


FXOpen
GBP/USD started a fresh increase and it broke the 1.3150 resistance zone. EUR/GBP is struggling and it could decline sharply if it breaks the 0.9010 support zone.
Important Takeaways for GBP/USD and EUR/GBP
- The British Pound steady upward move above the 1.3100 and 1.3120 resistance levels.
- There is a key contracting triangle forming with support near 1.3145 on the hourly chart of GBP/USD.
- EUR/GBP is struggling to gain momentum above the 0.9050 and 0.9070 levels.
- There is a major contracting triangle forming with resistance near 0.9045 on the hourly chart.
GBP/USD Technical Analysis
The British Pound retested the 1.2900 region before it started a fresh increase against the US Dollar. The GBP/USD pair broke the main 1.3000 resistance level to move back into a positive zone.
The upward move gained pace above the 1.3050 resistance and the 50 hourly simple moving average. There was also a break above the 1.3150 resistance and the pair traded as high as 1.3193 on FXOpen.
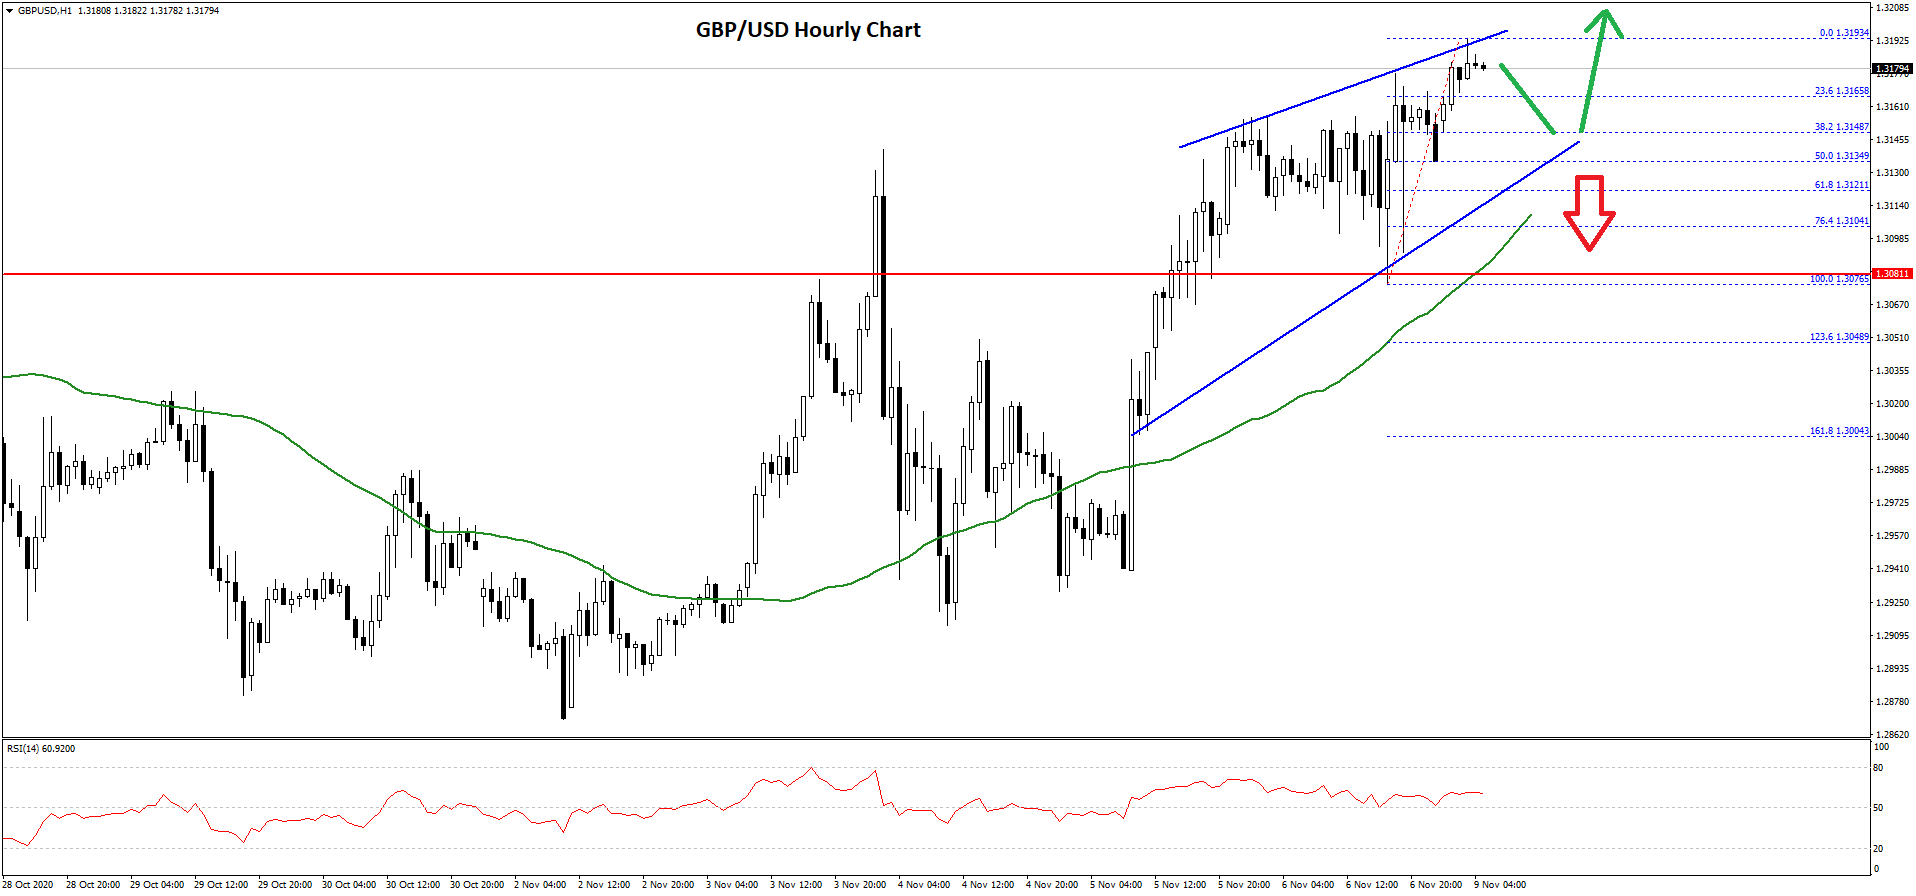
It is currently consolidating gains below the key 1.3200 resistance. An initial support is near the 1.3165 and the 23.6% Fib retracement level of the recent wave from the 1.3076 low to 1.3193 high. It seems like there is a key contracting triangle forming with support near 1.3145 on the hourly chart of GBP/USD.
The first major support is near the 1.3150 level. The breakdown support is close to the triangle lower trend line, and the 50% Fib retracement level of the recent wave from the 1.3076 low to 1.3193 high.
A clear break the triangle support and the 50 hourly simple moving average could start an extended decline towards the 1.3075 support level. Any further losses may perhaps lead the pair towards the 1.3000 support zone.
Conversely, the pair might continue to move up above the 1.3190 level. The main hurdle is near the 1.3200 level, above which the pair is likely to surge towards the 1.3240 and 1.3250 levels.
EUR/GBP Technical Analysis
The Euro followed a decent bullish path above 0.9000, but it continues to face a strong resistance near the 0.9070 level against the British Pound. The EUR/GBP pair is currently stuck in a broad range below the 0.9070 resistance and above the 0.9000 support.
The last swing low was 0.8988 before the pair climbed to 0.9052. It is currently declining and trading below the 38.2% Fib retracement level of the recent upward move from the 0.8988 swing low to 0.9052 high.
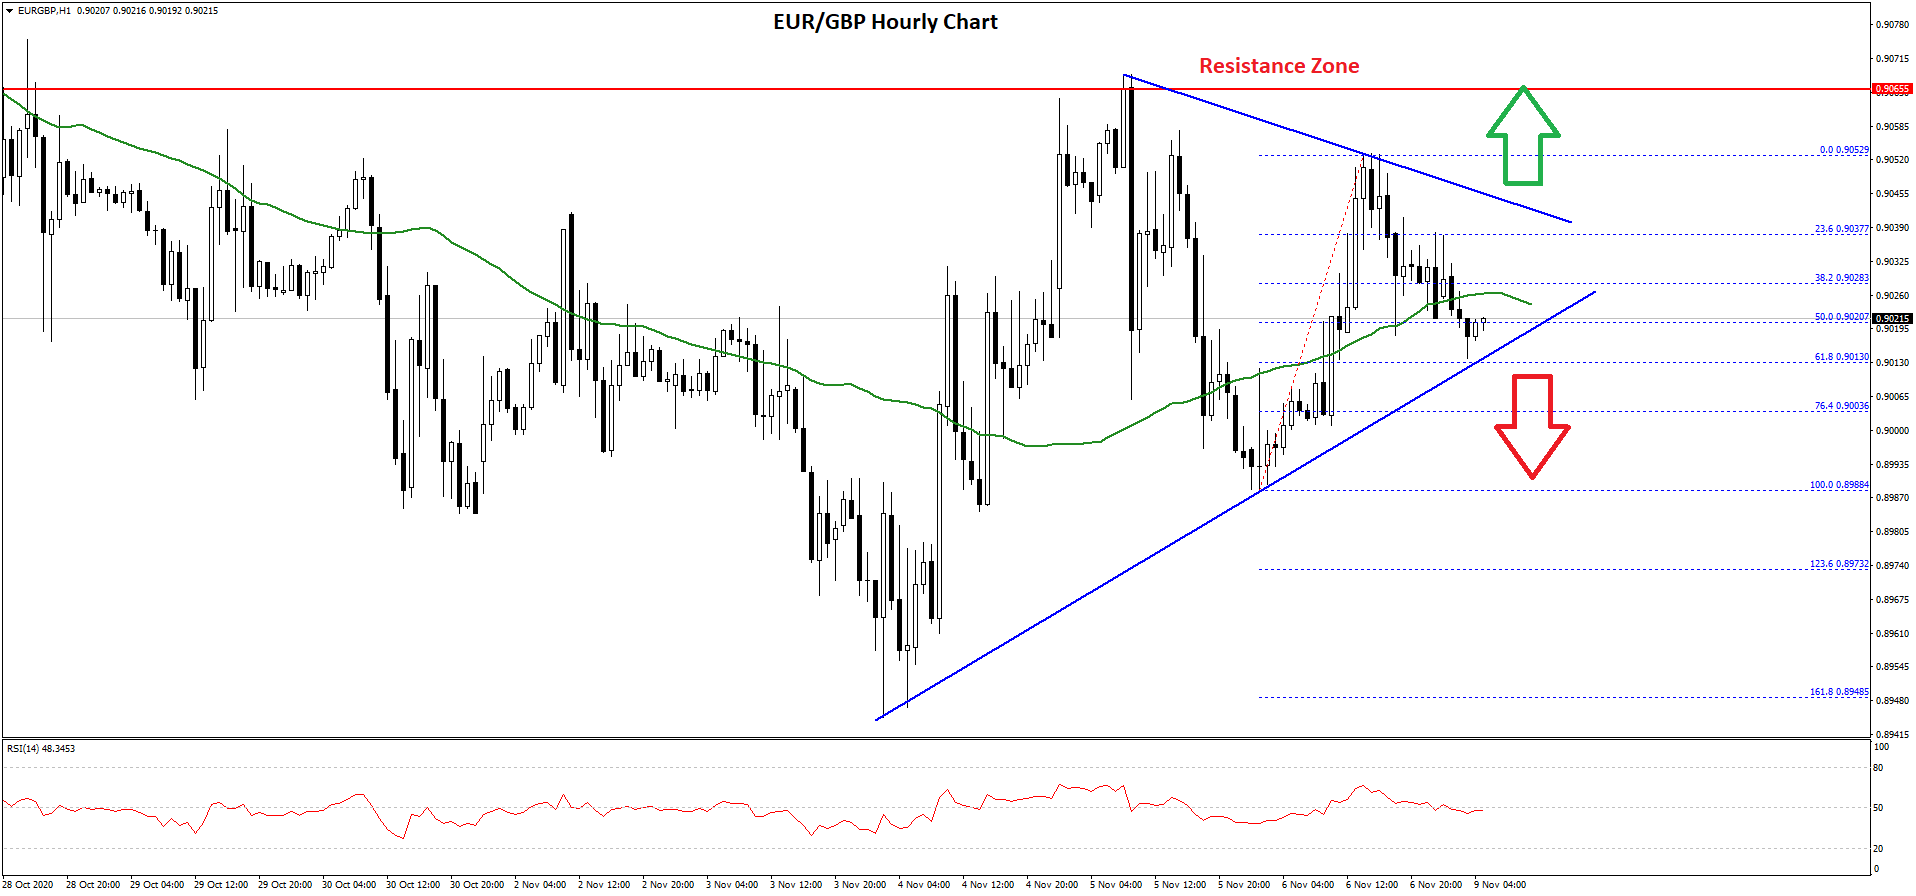
It seems like there is a major contracting triangle forming with resistance near 0.9045 on the hourly chart. The pair is currently trading below the 50 hourly simple moving average, and it is testing the 50% Fib retracement level of the recent upward move from the 0.8988 swing low to 0.9052 high.
If there is a downside break below the triangle support at 0.9010, there is a risk of more losses below the 0.9000 support. The next major support is near the 0.8960 level.
Conversely, the pair could break the triangle resistance near the 0.9045 level. The next major resistance is near the 0.9065 and 0.9070 levels. A successful close above the 0.9070 could open the doors for a steady rise towards the 0.9120 level.
Trade over 50 forex markets 24 hours a day with FXOpen. Take advantage of low commissions, deep liquidity, and spreads from 0.0 pips. Open your FXOpen account now or learn more about trading forex with FXOpen.
This article represents the opinion of the Companies operating under the FXOpen brand only. It is not to be construed as an offer, solicitation, or recommendation with respect to products and services provided by the Companies operating under the FXOpen brand, nor is it to be considered financial advice.
Stay ahead of the market!
Subscribe now to our mailing list and receive the latest market news and insights delivered directly to your inbox.

Latest from Forex Analysis
Latest articles

Weekly Market Wrap With Gary Thomson: Nasdaq, EUR/USD, USD/CHF, Brent Crude Oil, Googl Shares
Get the latest scoop on the week's hottest headlines, all in one convenient video. Join Gary Thomson, the COO of FXOpen UK, as he breaks down the most significant news reports and shares his expert insights.
- Nasdaq Composite: Worst Session

Analysis of AUD/USD: Exchange Rate Falls to Early May Low
As indicated by the 4-hour AUD/USD chart today:
→ the rate fell below 0.652, a level last seen on May 2;
→ the RSI indicator dropped below 15, a level last seen during the panic over the spread of COVID-19

Analysis of AMZN Stock: Price at 1.5-Month Low
As shown in the AMZN chart, the stock price dropped below:
→ the psychological level of $180;
→ the mid-June interim low.
The last time AMZN traded below $180 was in early June.
Thus, AMZN has faced sell-offs, similar to other tech