


GBP/USD Sighting Recovery, USD/CAD Remains in Uptrend
FXOpen
GBP/USD declined recently and tested the 1.3010 support before recovering. USD/CAD is currently correcting lower, but dips remain supported near 1.3070.
Important Takeaways for GBP/USD and USD/CAD
- The British Pound traded close to the 1.3000 support and it is currently recovering.
- There is a major bearish trend line in place with resistance near 1.3090 on the hourly chart of GBP/USD.
- USD/CAD is placed nicely above the 1.3080 and 1.3070 support levels.
- There is also a key bullish trend line formed with support at 1.3070 on the hourly chart.
GBP/USD Technical Analysis
The British Pound failed on many occasions to clear the 1.3240-1.3250 resistance area against the US Dollar. The GBP/USD pair started a fresh downside move and broke the 1.3120 and 1.3080 support levels.
There were heavy losses as the pair even closed below the 1.3100 level and the 50 hourly simple moving average. It traded close to the 1.3000 support area and formed a low at 1.3011.
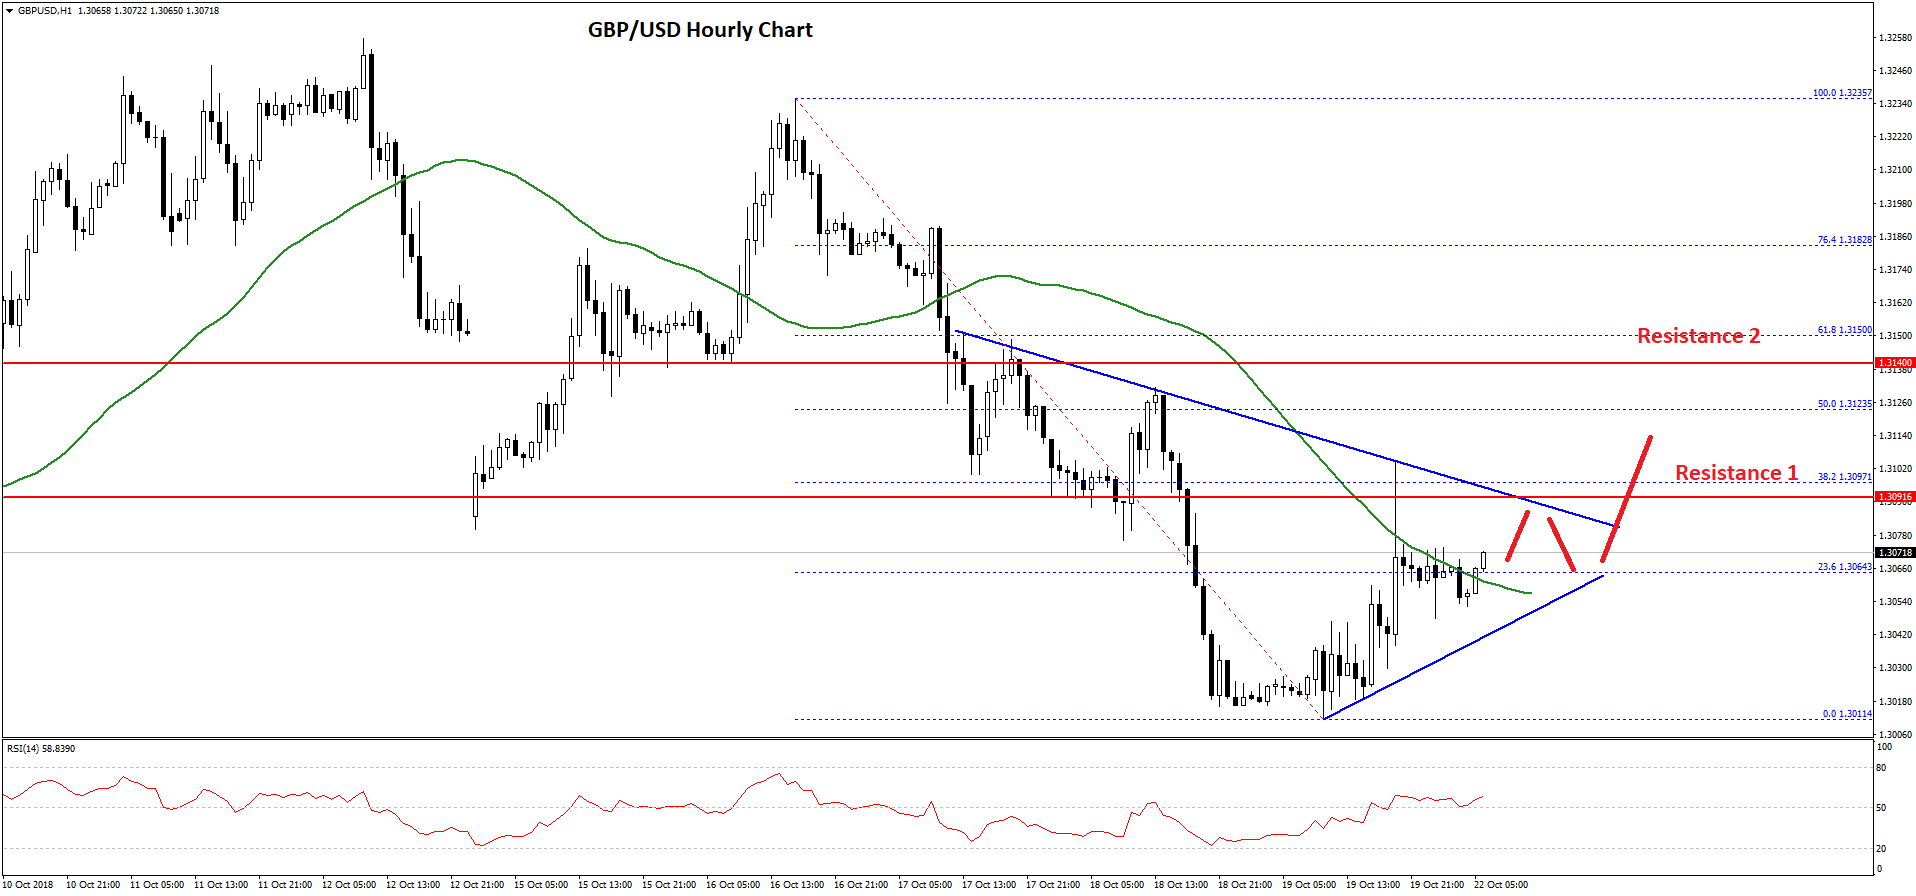
Later, the pair started a decent recovery and traded above the 1.3050 level. There was a break above the 23.6% Fib retracement level of the last decline from the 1.3235 high to 1.3011 low. The pair also traded above the 1.3080 level once and the 50 hourly SMA.
However, there is a strong resistance formed near the 1.3100 level. Moreover, there is a major bearish trend line in place with resistance near 1.3090 on the hourly chart.
Besides, the 38.2% Fib retracement level of the last decline from the 1.3235 high to 1.3011 low is also near 1.3095. Therefore, if the pair continues to move higher, it is likely to find a strong selling interest near the 1.3070 or 1.3090 levels.
Above 1.3090 or 1.3100, the pair is likely to recover further towards the 1.3120 or 1.3140 levels. On the flip side, if the pair breaks down and fails to recover above 1.3100, it could decline back towards the 1.3000 support area.
USD/CAD Technical Analysis
The US Dollar started a nasty upside move from the 1.2920 support area against the Canadian Dollar. The USD/CAD pair climbed higher and broke the 1.2980 and 1.3000 resistance levels.
The upside move was such that the pair even broke the 1.3050 resistance and settled above the 50 hourly simple moving average. Buyers pushed the pair above the 1.3120 level and a high was formed near the 1.3132 level.
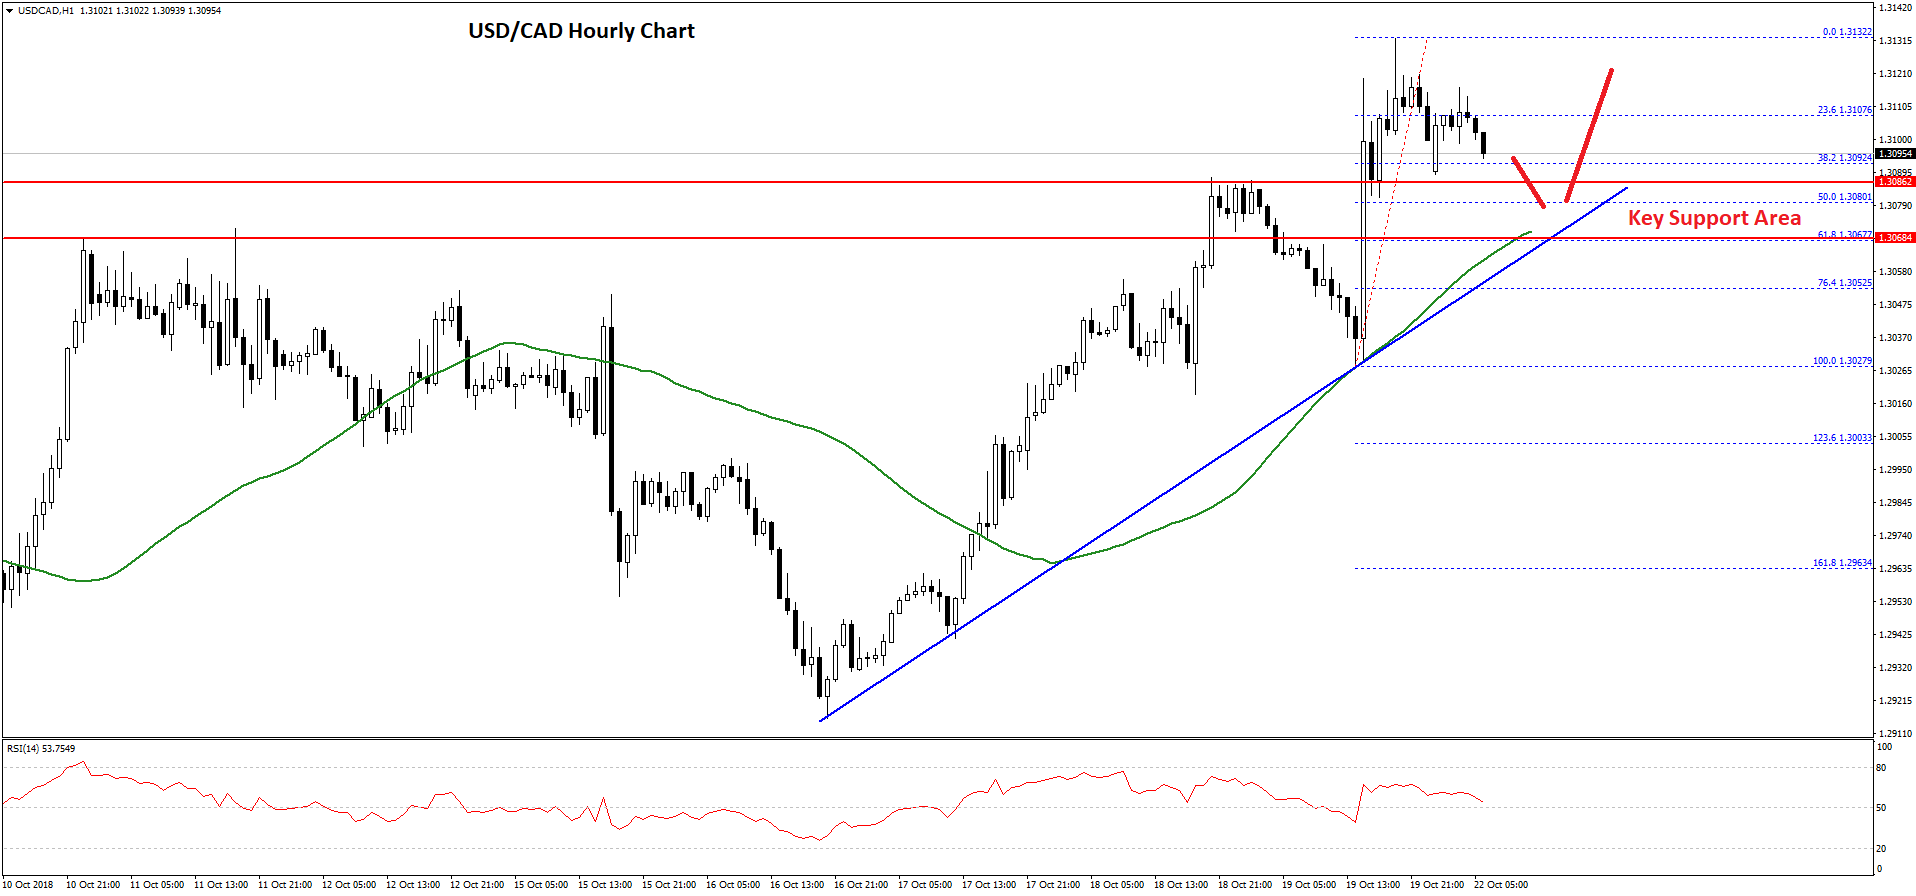
Later, the pair started a downside correction and the pair traded below the 1.3100. There was also a break below the 23.6% Fib retracement level of the last wave from the 1.3027 low to 1.3132 high.
However, the pair remains in a solid uptrend since there are many supports near the 1.3080 and 1.3070 levels. There is also a key bullish trend line formed with support at 1.3070 on the hourly chart.
Moreover, the 50% Fib retracement level of the last wave from the 1.3027 low to 1.3132 high is positioned near the 1.3080 level. Therefore, dips from the current levels towards the 1.3080 and 1.3070 levels are likely to find a strong buying interest.
Below 1.3070, the pair could extend the downside correction towards the 1.3027 swing low or the 1.3010 level. On the upside, the pair must break the 1.3120 and 1.3130 resistances to climb towards the 1.3200 level in the near term.
Trade over 50 forex markets 24 hours a day with FXOpen. Take advantage of low commissions, deep liquidity, and spreads from 0.0 pips (additional fees may apply). Open your FXOpen account now or learn more about trading forex with FXOpen.
This article represents the opinion of the Companies operating under the FXOpen brand only. It is not to be construed as an offer, solicitation, or recommendation with respect to products and services provided by the Companies operating under the FXOpen brand, nor is it to be considered financial advice.
Stay ahead of the market!
Subscribe now to our mailing list and receive the latest market news and insights delivered directly to your inbox.


Latest articles

Apple: Earnings Day Above the Activity Zone
On 30 April, after the market close, Apple Inc. will release its financial results for the second quarter of fiscal 2026. The consensus forecast, based on estimates from 31 analysts, points to revenue of around $109.7 billion, with expected

USD/JPY and USD/CHF Near Key Levels: The Dollar Supported by the Fed
The US dollar continues to trend upwards following the Federal Reserve meeting, drawing support from the regulator’s moderately hawkish stance and comments by Jerome Powell. Markets interpret the Fed’s rhetoric as a signal that restrictive policy is likely

EUR/USD and GBP/USD consolidate ahead of the Fed decision
European currencies are showing subdued dynamics, entering a consolidation phase following their previous advance. Earlier, EUR/USD and GBP/USD broke out of their ranges and strengthened; however, the subsequent correction has led both pairs to retest the previously breached