


FXOpen
GBP/USD failed to gain strength above 1.3200 and recently started a fresh decline below 1.3100. USD/CAD is also declining, but it is approaching a key support near the 1.3030 area.
Important Takeaways for GBP/USD and USD/CAD
- The British Pound topped near the 1.3200 area and declined below the 1.3100 support.
- There is a key bearish trend line forming with resistance near 1.3065 on the hourly chart of GBP/USD.
- USD/CAD climbed towards the 1.3100 area and recently started a downside correction.
- There is a major bullish trend line forming with support near 1.3045 on the hourly chart.
GBP/USD Technical Analysis
This past week, the British Pound made another attempt to settle above the 1.3200 area against the US Dollar. However, the GBP/USD pair failed to gain traction and later started a fresh decline below 1.3150.
It broke a couple of important supports near the 1.3100 area to enter a bearish zone. Moreover, there was a close below the 1.3100 level and the 50 hourly simple moving average.
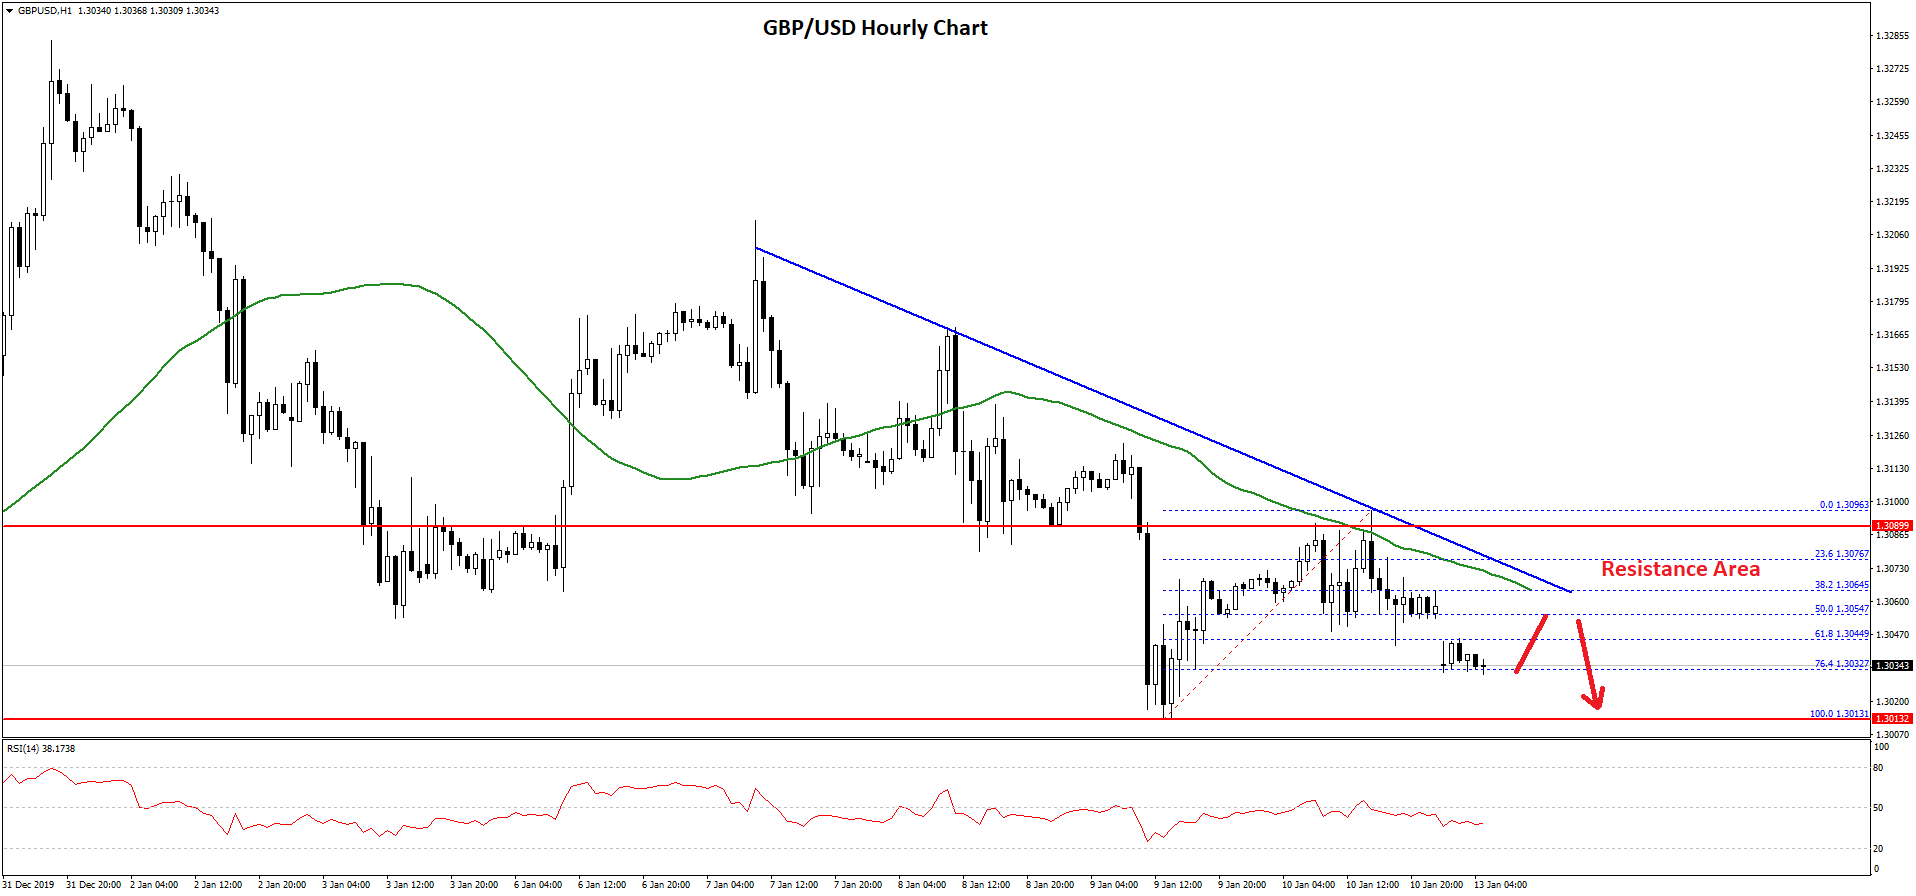
The pair traded close to the 1.3000 area and a low was formed at 1.3013 on FXOpen. Recently, there was a minor upside correction, but the 1.3100 area acted as a hurdle along with the 50 hourly simple moving average.
A high is formed and the pair traded below the 50% Fib retracement level of the upward move from the 1.3013 low to 1.3096 high.
The current price action indicates more losses below the 1.3050 level. The pair is now trading near the 1.3030 area, plus the 76.4% Fib retracement level of the upward move from the 1.3013 low to 1.3096 high.
Therefore, a downside break below the 1.3030 area could open the doors for more losses below the 1.3010 and 1.3000 levels.
On the upside, there are many hurdles for the bulls near the 1.3060 and 1.3070 levels. Moreover, there is a key bearish trend line forming with resistance near 1.3065 on the hourly chart of GBP/USD.
A successful break above the trend line and a follow through above the 1.3100 resistance area is needed for a fresh increase towards the 1.3200 area in the near term.
USD/CAD Technical Analysis
The US Dollar remained in a strong uptrend above the 1.3000 pivot level against the Canadian Dollar. As a result, the USD/CAD pair even broke the 1.3050 resistance and climbed towards the 1.3100 level.
A high was formed near 1.3104 and recently the pair started a downside correction. There was a break below the 1.3050 support, but the pair found support near the 1.3030 level.
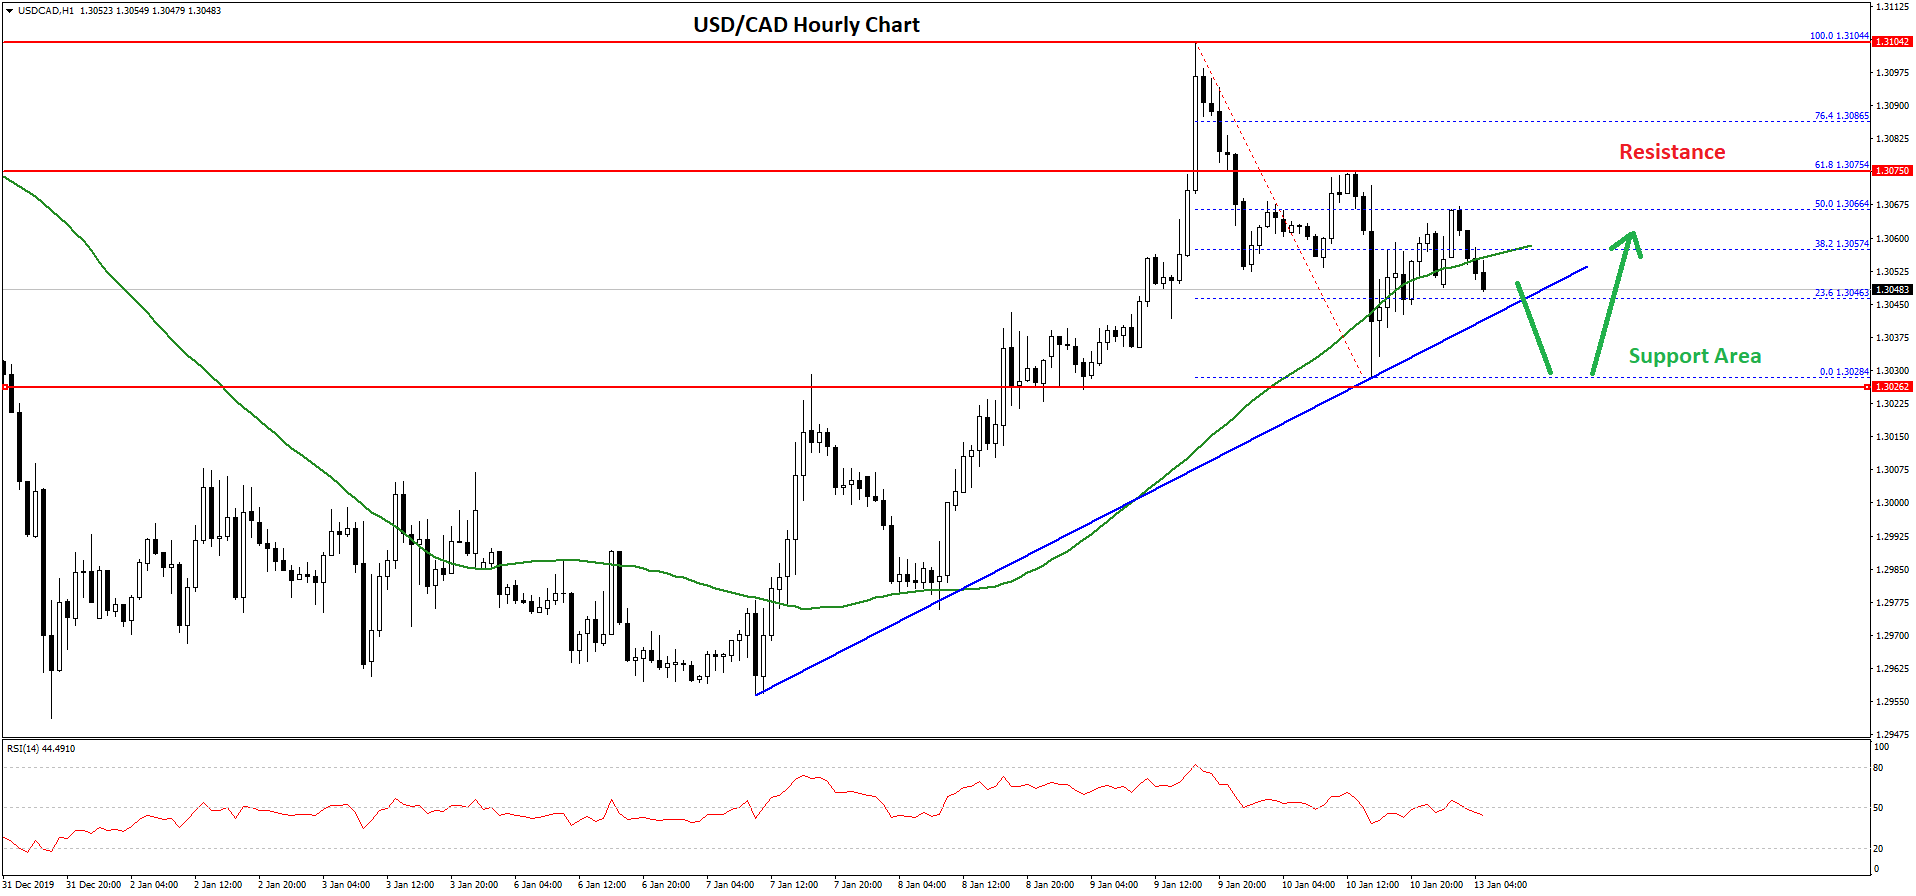
A low was formed near 1.3028 and the pair bounced back above 1.3050 and the 50 hourly simple moving average. Moreover, there was a break above the 23.6% Fib retracement level of the latest decline from the 1.3104 high to 1.3028 low.
However, the upward move was capped by 1.3065, plus the 50% Fib retracement level of the latest decline from the 1.3104 high to 1.3028 low.
It is currently declining and approaching a major bullish trend line with support near 1.3045 on the hourly chart. If there is a downside break below the trend line, the pair could test the 1.3030 support area.
As long as USD/CAD is trading above 1.3030 and 1.3000, it is likely to bounce back and climb above 1.3000 in the coming sessions.
Trade over 50 forex markets 24 hours a day with FXOpen. Take advantage of low commissions, deep liquidity, and spreads from 0.0 pips. Open your FXOpen account now or learn more about trading forex with FXOpen.
This article represents the opinion of the Companies operating under the FXOpen brand only. It is not to be construed as an offer, solicitation, or recommendation with respect to products and services provided by the Companies operating under the FXOpen brand, nor is it to be considered financial advice.
Stay ahead of the market!
Subscribe now to our mailing list and receive the latest market news and insights delivered directly to your inbox.

Latest from Forex Analysis
Latest articles

Weekly Market Wrap With Gary Thomson: Nasdaq, EUR/USD, USD/CHF, Brent Crude Oil, Googl Shares
Get the latest scoop on the week's hottest headlines, all in one convenient video. Join Gary Thomson, the COO of FXOpen UK, as he breaks down the most significant news reports and shares his expert insights.
- Nasdaq Composite: Worst Session

Analysis of AUD/USD: Exchange Rate Falls to Early May Low
As indicated by the 4-hour AUD/USD chart today:
→ the rate fell below 0.652, a level last seen on May 2;
→ the RSI indicator dropped below 15, a level last seen during the panic over the spread of COVID-19

Analysis of AMZN Stock: Price at 1.5-Month Low
As shown in the AMZN chart, the stock price dropped below:
→ the psychological level of $180;
→ the mid-June interim low.
The last time AMZN traded below $180 was in early June.
Thus, AMZN has faced sell-offs, similar to other tech