


GBP/USD Starts Fresh Decline, EUR/GBP Remains Supported
FXOpen
GBP/USD started a fresh decline from well above the 1.3700 level. EUR/GBP is showing positive signs, with a strong support near the 0.8340 level.
Important Takeaways for GBP/USD and EUR/GBP
· The British Pound started a fresh decline from well above 1.3700 against the US Dollar.
· There was a break below a key bullish trend line with support near 1.3620 on the hourly chart of GBP/USD.
· EUR/GBP found support near 0.8300 and started a fresh increase.
· There was a break above a major bearish trend line with resistance near 0.8330 on the hourly chart.
GBP/USD Technical Analysis
The British Pound struggled to settle above the 1.3750 resistance zone against the US Dollar. The GBP/USD pair started a fresh decline below the 1.3620 support zone.
There was a clear move below the 1.3600 level and the 50 hourly simple moving average. Besides, there was a break below a key bullish trend line with support near 1.3620 on the hourly chart of GBP/USD.
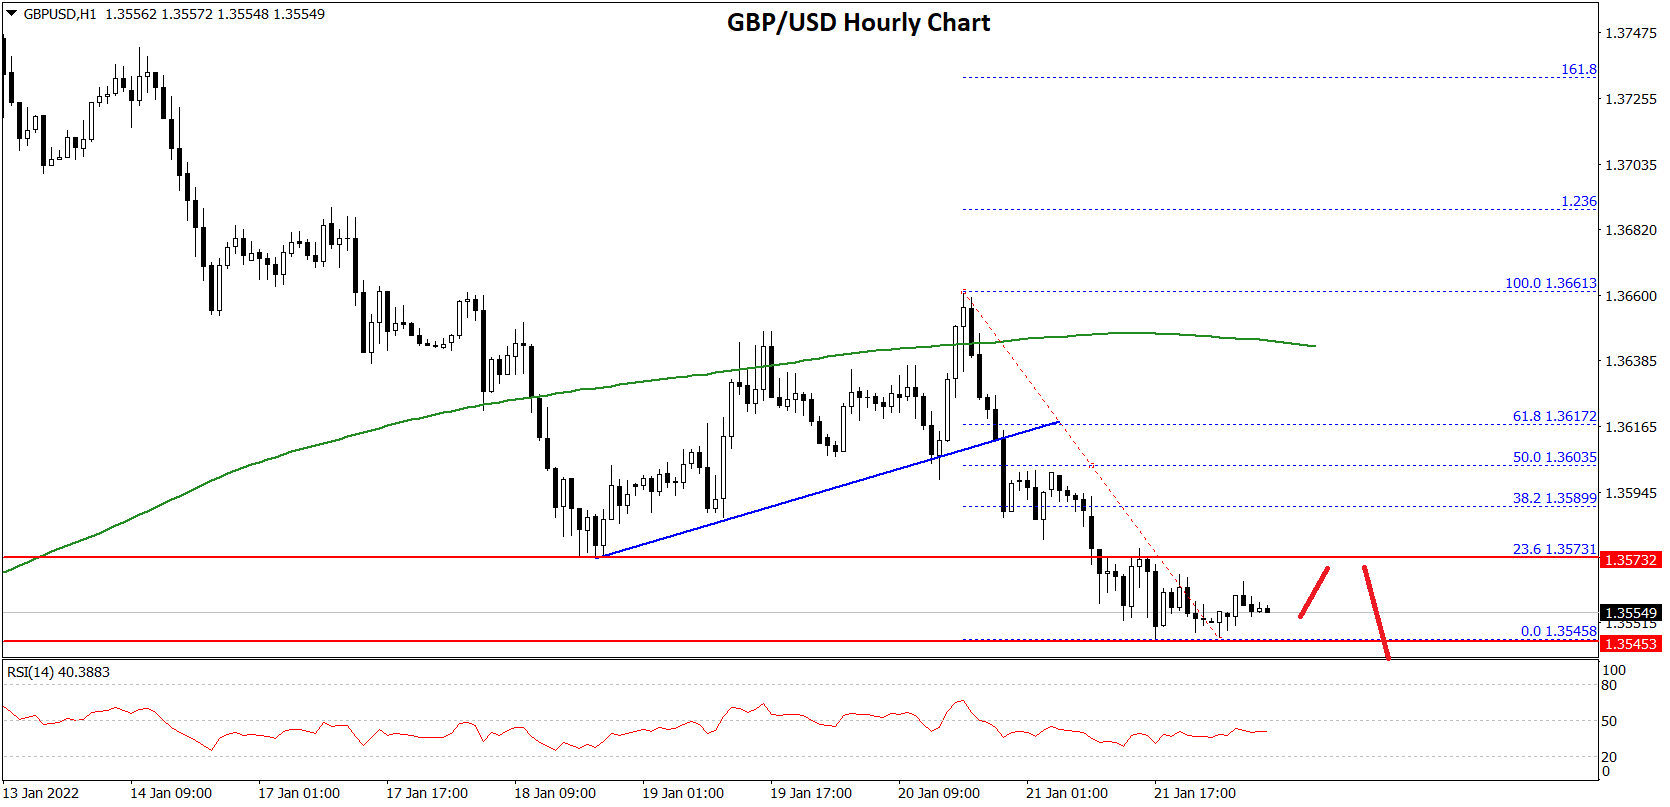
A low is formed near 1.3545 on FXOpen and the pair is now consolidating losses. On the upside, an initial resistance is near the 1.3575 level. It is near the 23.6% Fib retracement level of the downward move from the 1.3661 swing high to 1.3545 low.
The next main resistance is near the 1.3600 zone. It is near the 50% Fib retracement level of the downward move from the 1.3661 swing high to 1.3545 low.
If there is an upside break above the 1.3600 resistance, the price could surpass 1.3625 or even 1.3650. If there is no upside break, the pair could start a fresh decline below 1.3540. An immediate support is near the 1.3520 level.
The first key support is near the 1.3500 level. Any more losses could lead the pair towards the 1.3450 support zone. The next major support sits near the 1.3420 level.
EUR/GBP Technical Analysis
The Euro formed a base above the 0.8300 level against the British Pound. The EUR/GBP pair started a major increase above the 0.8330 resistance zone.
There was a clear move above the 0.8340 level and the 50 hourly simple moving average. Besides, there was a break above a major bearish trend line with resistance near 0.8330 on the hourly chart. The pair climbed above the 0.8550 resistance zone.
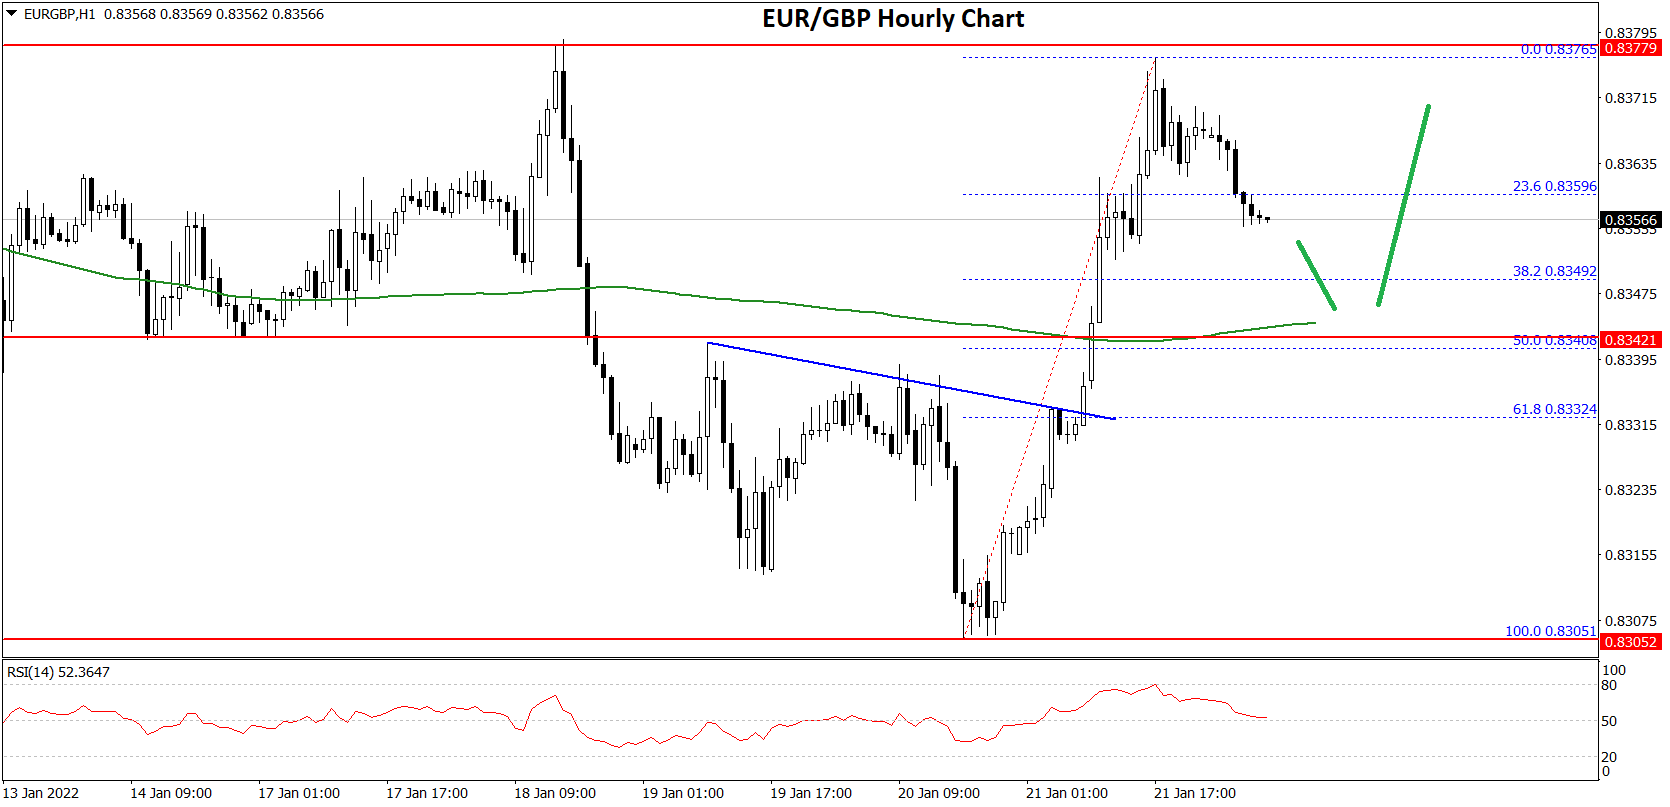
A high was formed near 0.8376 and the pair is now correcting lower. There was a move below the 23.6% Fib retracement level of the upward move from the 0.8305 swing low to 0.8376 high.
On the downside, an initial support is near the 0.8350 level. The next major support is near 0.8340 level. It is near the 50% Fib retracement level of the upward move from the 0.8305 swing low to 0.8376 high. A downside break below the 0.8350 and 0.8340 support levels might call for more downsides. In the stated case, the pair could decline towards the 0.8300 support level in the near term.
On the upside, the pair is facing resistance near the 0.8370 level. The next major resistance for the bulls is near the 0.8380 level. A clear move above the 0.8480 resistance might push the price higher. The next main resistance on the upside is near the 0.8520 level.
This forecast represents FXOpen Markets Limited opinion only, it should not be construed as an offer, invitation or recommendation in respect to FXOpen Markets Limited products and services or as financial advice.
Trade over 50 forex markets 24 hours a day with FXOpen. Take advantage of low commissions, deep liquidity, and spreads from 0.0 pips (additional fees may apply). Open your FXOpen account now or learn more about trading forex with FXOpen.
This article represents the opinion of the Companies operating under the FXOpen brand only. It is not to be construed as an offer, solicitation, or recommendation with respect to products and services provided by the Companies operating under the FXOpen brand, nor is it to be considered financial advice.
Stay ahead of the market!
Subscribe now to our mailing list and receive the latest market news and insights delivered directly to your inbox.


Latest articles

Market Analysis: EUR/USD Revisits Support While USD/JPY Eyes Bigger Recovery Move
EUR/USD declined from 1.1800 and traded below 1.1750. USD/JPY is rising and might gain pace above 158.00 and 158.80.
Important Takeaways for EUR/USD and USD/JPY Analysis Today
· The Euro started a fresh

Dollar Gains After CPI: USD/JPY and USD/CAD Test Resistance
The US dollar strengthened following the release of stronger-than-expected inflation data, which reinforced expectations that the Federal Reserve will maintain a restrictive monetary policy stance. US consumer prices rose to their highest levels since May 2023, renewing concerns over persistent

XRP/USD: Consolidation Amid Regulatory Expectations
Fundamental Background
The key event for XRP in May remains the fate of the CLARITY Act, which is expected to establish XRP’s status as a digital commodity at the federal level. According to CoinMarketCap, the Senate Banking Committee has