


GBP/USD Starts Recovery While USD/CAD Faces Key Resistance
FXOpen
GBP/USD is correcting losses and trading above the 1.2000 zone. USD/CAD is struggling to clear the 1.3650 resistance zone.
Important Takeaways for GBP/USD and USD/CAD
· The British Pound started a decent recovery wave above the 1.2000 resistance zone.
· There was a break above a key bearish trend line with resistance near 1.1965 on the hourly chart of GBP/USD.
· USD/CAD is struggling below the 1.3640 and 1.3650 support levels.
· There is a major bearish trend line forming with resistance near 1.3640 on the hourly chart.
GBP/USD Technical Analysis
The British Pound started a fresh decline from well above 1.2120 against the US Dollar. The GBP/USD pair gained bearish momentum after there was a break below the 1.2050 support.
The pair even broke the 1.2000 support level and the 50 hourly simple moving average. The recent swing high was formed near 1.1925 on FXOpen before the price started an upside correction. There was a move above the 1.1980 level.
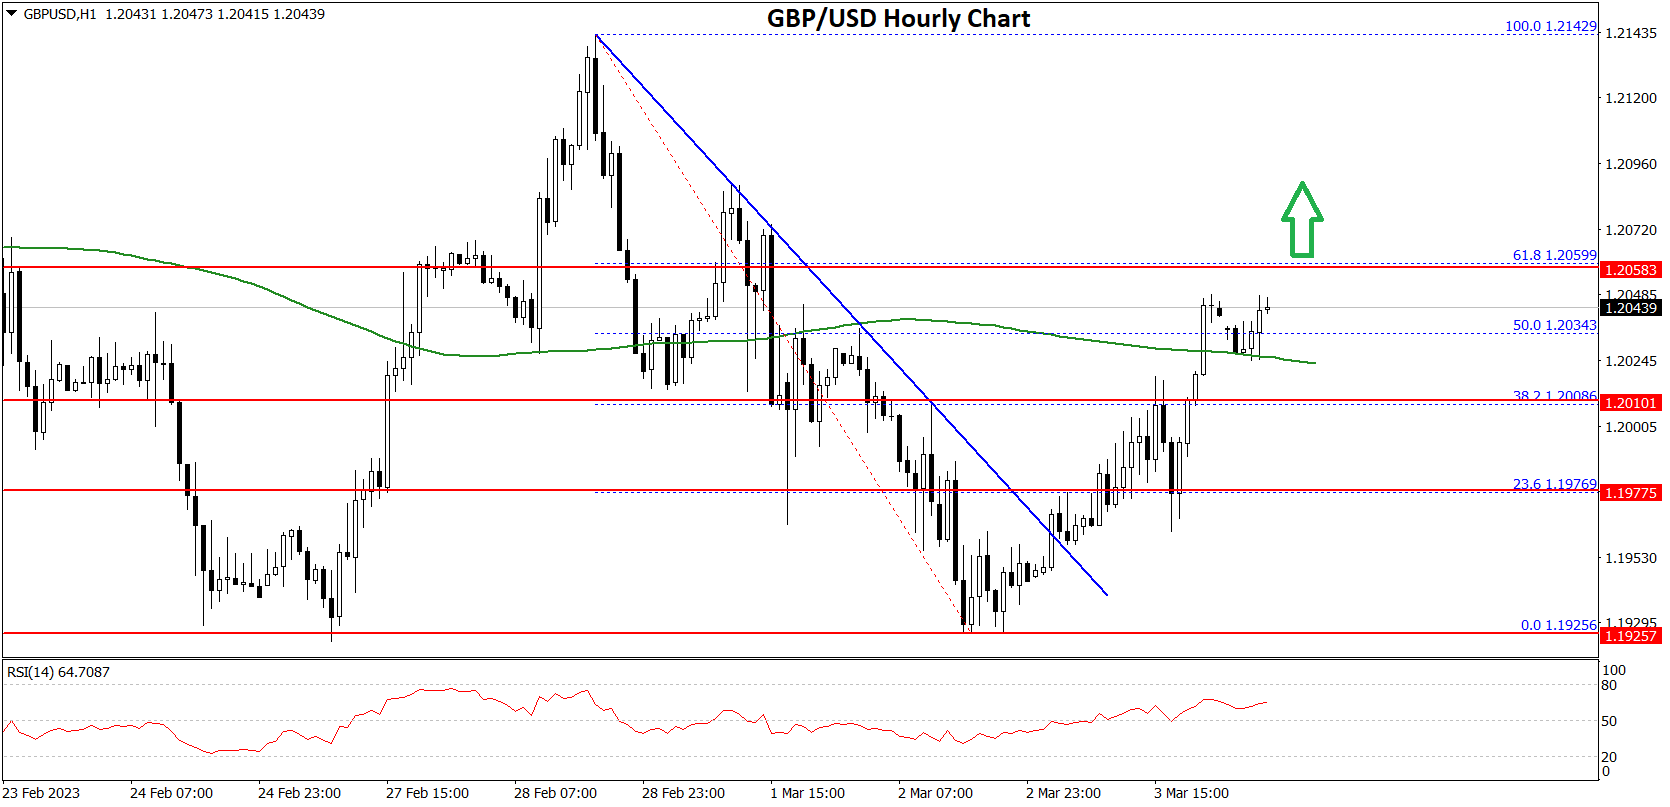
There was a break above a key bearish trend line with resistance near 1.1965 on the hourly chart of GBP/USD. Besides, there was a move above the 50% Fib retracement level of the downward move from the 1.2142 swing high to 1.1925 low.
An immediate resistance is near the 1.2050 level. It is near the 61.8% Fib retracement level of the downward move from the 1.2142 swing high to 1.1925 low.
The next major resistance is near the 1.2080 level. Any more gains could lead the pair towards the 1.2120 barrier in the near term. If not, the pair could move down and might break the 1.2000 support. The next major support is near 1.1980.
If there is a downside break, GBP/USD might test the 1.1920 support. The next major support sits at 1.1850, where the bulls might take a stand.
USD/CAD Technical Analysis
The US Dollar gained pace for a move above the 1.3600 resistance zone against the Canadian Dollar. The USD/CAD pair struggled to clear the 1.3650 resistance zone and started a minor downside correction.
A high was formed near 1.3643 and there was a downside correction. The pair declined below the 1.3610 level. Besides, there was a move below the 50% Fib retracement level of the upward move from the 1.3554 swing low to 1.3643 high.
The pair tested the 1.3590 level. It is near the 61.8% Fib retracement level of the upward move from the 1.3554 swing low to 1.3643 high.
On the downside, the pair is likely to find bids near 1.3590. The next major support is near the 1.3560 level. A downside break below 1.3560 support level could push the pair further lower. The next major support is near the 1.3520 zone, below which the pair could even test 1.3480. Any more losses might call for a move to 1.3420.
On the upside, the pair is facing hurdles near 1.3640. There is also a major bearish trend line forming with resistance near 1.3640 on the hourly chart.
The next major resistance is near the 1.3650 level, above which the pair could rise towards the 1.3700 level. Any more gains could send the pair towards the 1.3750 level.
This forecast represents FXOpen Markets Limited opinion only, it should not be construed as an offer, invitation or recommendation in respect to FXOpen Markets Limited products and services or as financial advice.
Trade over 50 forex markets 24 hours a day with FXOpen. Take advantage of low commissions, deep liquidity, and spreads from 0.0 pips (additional fees may apply). Open your FXOpen account now or learn more about trading forex with FXOpen.
This article represents the opinion of the Companies operating under the FXOpen brand only. It is not to be construed as an offer, solicitation, or recommendation with respect to products and services provided by the Companies operating under the FXOpen brand, nor is it to be considered financial advice.
Stay ahead of the market!
Subscribe now to our mailing list and receive the latest market news and insights delivered directly to your inbox.


Latest articles

Weekly Market Insights with Gary Thomson: The Week of Central Banks and Earnings
In this video, we’ll explore the key economic events and market trends, shaping the financial landscape. Get ready for insights into financial markets to help you navigate the week ahead. Let’s dive in!
In this episode of Market

Intel at a Crossroads: Earnings Beat Meets Technical Resistance
Intel has just delivered its strongest quarter in over fifteen years, and the market reaction says it all. Q2 2026 revenue surged 25% year-over-year to $16.1 billion, crushing the consensus estimate of $14.42 billion, while adjusted EPS of

Tesla: Complex Range Structure Breaks Down Following Quarterly Earnings
Tesla released its Q2 2026 results after the market closed on 22 July. Revenue increased 26% year-on-year to $28.24 billion, while vehicle deliveries reached a record 480,126 units. However, operating margin fell sharply to 1.4%, down from