


GBP/USD Struggles Below 1.3900, USD/CAD Could Extend Gains
FXOpen

GBP/USD started a fresh decline after it failed to surpass the 1.4000 resistance. USD/CAD is rising and it is showing a lot of positive signs above the 1.2450 level.
Important Takeaways for GBP/USD and USD/CAD
- The British Pound started a fresh decline after it was rejected near the 1.4000 area.
- There was a break below a major bullish trend line with support near 1.3910 on the hourly chart of GBP/USD.
- USD/CAD traded towards the 1.2375 support zone before starting an upside correction.
- There was a break above a major bearish trend line with resistance near 1.2455 on the hourly chart.
GBP/USD Technical Analysis
This past week, the British Pound made another attempt to clear the 1.3990 and 1.4000 resistance levels against the US Dollar. The GBP/USD pair failed to gain strength and started a fresh decline below the 1.3950 support zone.
There was a clear break below the 1.3920 support level and the 50 hourly simple moving average. There was also a break below the 1.3850 support level. Moreover, there was a break below a major bullish trend line with support near 1.3910 on the hourly chart of GBP/USD.

The pair traded as low as 1.3817 on FXOpen and it is currently consolidating losses. An initial resistance on the upside is near the 1.3850 level. It is close to the 23.6% Fib retracement level of the downward move from the 1.3959 high to 1.3817 low.
The first major resistance is near the 1.3880 level. The 50% Fib retracement level of the downward move from the 1.3959 high to 1.3817 low is also near 1.3880 level.
The main resistance is now forming near 1.3910 and the 50 hourly simple moving average. A successful close above the 1.3880 and 1.3900 levels could open the doors for a decent increase in the coming sessions.
Conversely, the pair might continue to move down below the 1.3820 and 1.3800 support levels. Any more losses may possibly open the doors for a push towards the 1.3740 support level.
USD/CAD Technical Analysis
The US Dollar started a major decline from well above 1.2600 against the Canadian Dollar. The USD/CAD pair traded towards the 1.2375 zone before it started a fresh increase.
Recently, there was a break above the 1.2420 and 1.2440 resistance levels. There was a break above a major bearish trend line with resistance near 1.2455 on the hourly chart. The pair is now trading above the 1.2500 level and the 50 hourly simple moving average.
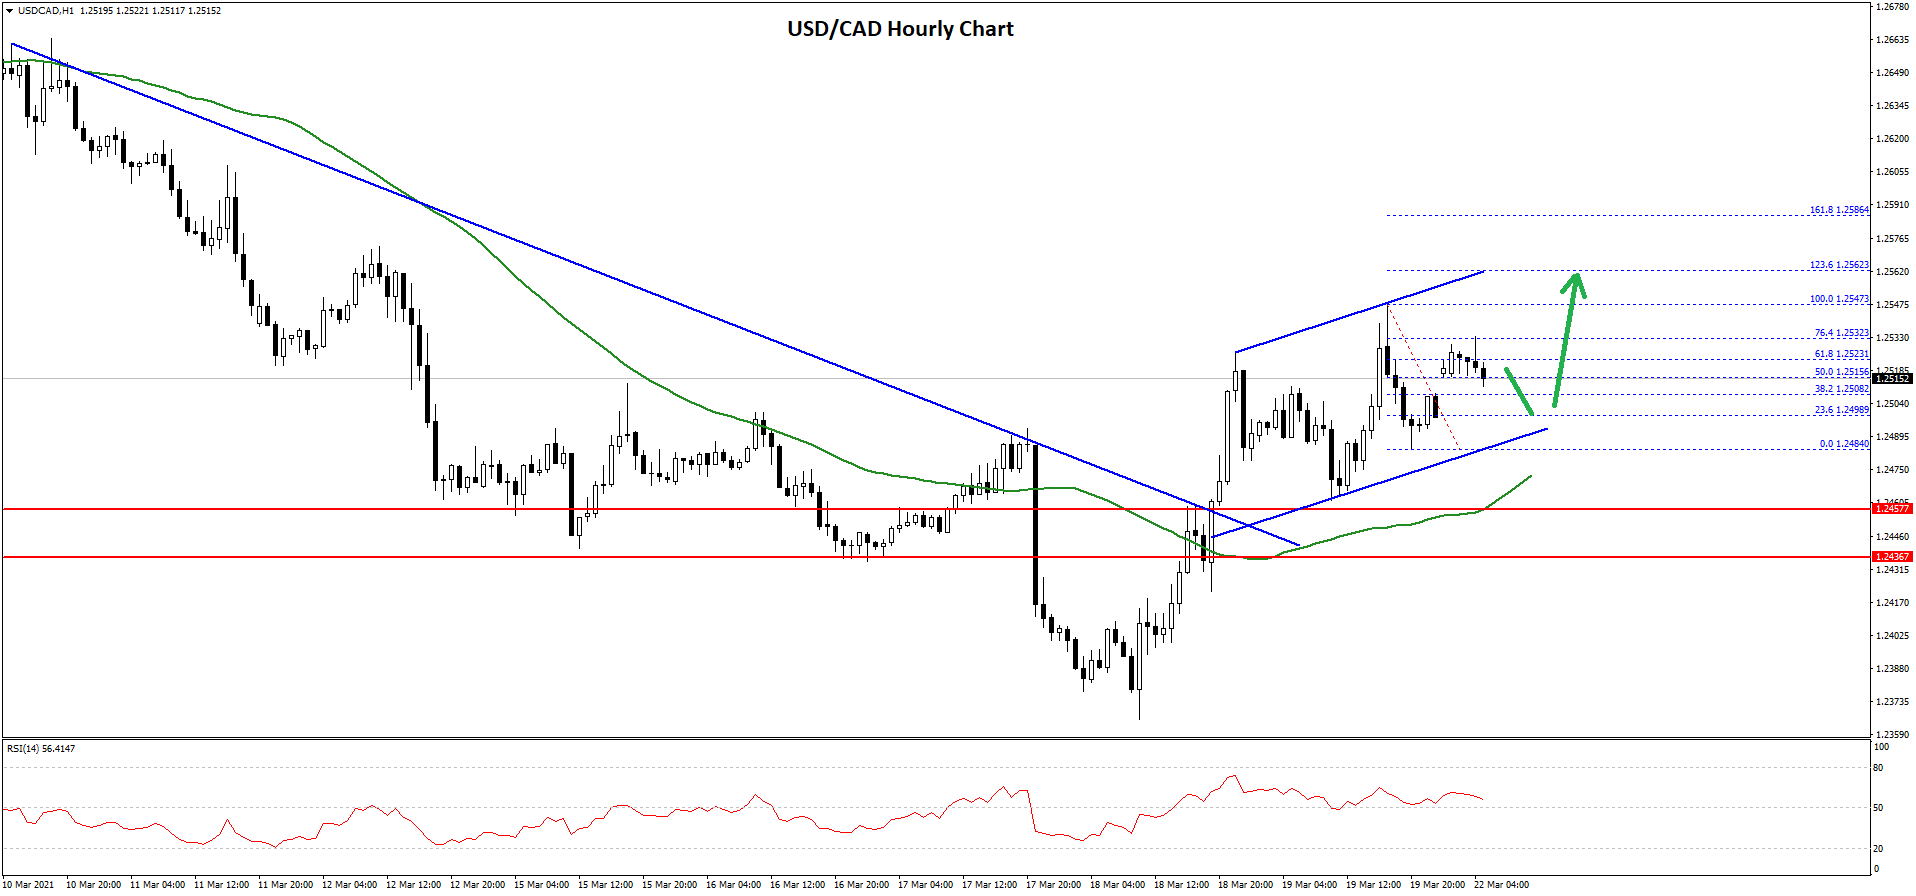
It even spiked above 1.2500 and traded as high as 1.2547. There was a minor drop from 1.2547 to 1.2484. The pair corrected higher and traded above the 50% Fib retracement level of the recent decline from the 1.2547 high to 1.2484 low.
However, the pair is now struggling to clear the 1.2530 zone. It is close to the 76.4% Fib retracement level of the recent decline from the 1.2547 high to 1.2484 low.
On the upside, the 1.2550 level is a key resistance. Therefore, a successful break and close above the 1.2550 resistance level could lead the pair towards the 1.2620 and 1.2640 levels. If not, there is a risk of a fresh decline towards the 1.2475 level and the 50 hourly simple moving average. The next major support sits near the 1.2435 level.
Trade over 50 forex markets 24 hours a day with FXOpen. Take advantage of low commissions, deep liquidity, and spreads from 0.0 pips (additional fees may apply). Open your FXOpen account now or learn more about trading forex with FXOpen.
This article represents the opinion of the Companies operating under the FXOpen brand only. It is not to be construed as an offer, solicitation, or recommendation with respect to products and services provided by the Companies operating under the FXOpen brand, nor is it to be considered financial advice.
Stay ahead of the market!
Subscribe now to our mailing list and receive the latest market news and insights delivered directly to your inbox.


Latest articles

DAX 40: consolidation amid technology sell-off
A wave of selling in the technology sector that emerged earlier this week has weighed on European equities. The trigger was investor concern over the profitability of large-scale debt-funded investments by major US tech companies in AI infrastructure. The Nasdaq

Euro Hits Fresh Yearly Lows Amid Dovish ECB Signals
The euro remains under pressure following weak macroeconomic data from the euro area and fresh signals that the European Central Bank is prepared to maintain a more accommodative monetary policy stance. Data released yesterday pointed to a deterioration in business

Pound at Key Levels: Markets Assess Impact of Political Uncertainty in the UK
The British pound remains under pressure following increased political uncertainty in the United Kingdom triggered by the Prime Minister’s resignation. Investors are assessing potential shifts in the political and economic policy outlook after the head of government stepped down,