FXOpen

GBP/USD started a fresh decline from well above the 1.3600 level. EUR/GBP is also declining and trading below the 0.8420 support zone.
Important Takeaways for GBP/USD and EUR/GBP
· The British Pound started a fresh decline from well above 1.3600 against the US Dollar.
· There is a key bullish trend line forming with support near 1.3530 on the hourly chart of GBP/USD.
· EUR/GBP failed to surpass 0.8480 and started a fresh decline.
· There is a major bearish trend line forming with resistance near 0.8415 on the hourly chart.
GBP/USD Technical Analysis
The British Pound struggled to settle above the 1.3600 resistance zone against the US Dollar. The GBP/USD pair started a fresh decline below the 1.3580 support zone.
There was a clear move below the 1.3550 level and the 50 hourly simple moving average. The bears pushed the pair below the 50% Fib retracement level of the upward move from the 1.3513 swing low to 1.3609 high.
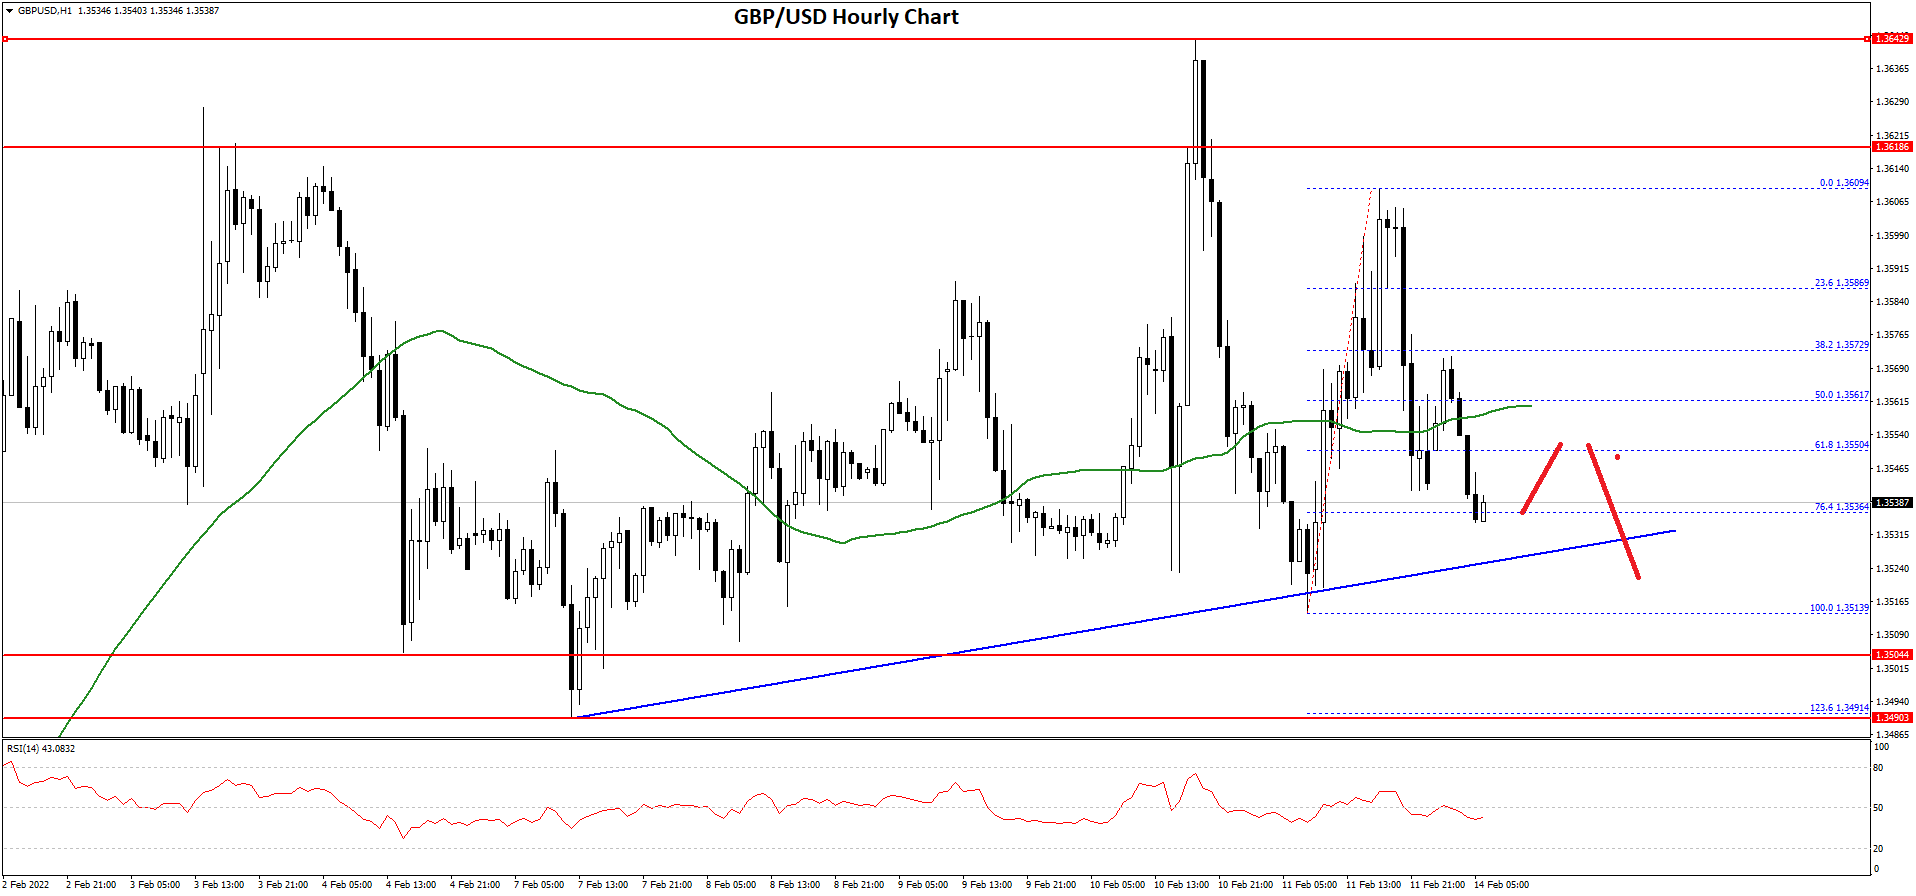
It is now trading below the 1.3550 level and testing the 76.4% Fib retracement level of the upward move from the 1.3513 swing low to 1.3609 high.
An immediate support is near the 1.3530 level. There is also a key bullish trend line forming with support near 1.3530 on the hourly chart of GBP/USD. The first key support is near the 1.3510 level. Any more losses could lead the pair towards the 1.3450 support zone.
The next major support sits near the 1.3420 level. On the upside, an initial resistance is near the 1.3560 level and the 50 hourly simple moving average.
The next main resistance is near the 1.3600 zone. If there is an upside break above the 1.3600 resistance, the price could gain bullish momentum. In the stated case, GBP/USD might rise to 1.3680.
EUR/GBP Technical Analysis
The Euro rallied above the 0.8380 and 0.8400 resistance levels against the British Pound. However, the EUR/GBP pair struggled to clear the 0.8480 level and started a fresh decline.
There was a clear move below the 0.8450 level and the 50 hourly simple moving average. The pair traded below the 50% Fib retracement level of the upward move from the 0.8285 swing low to 0.8477 high.
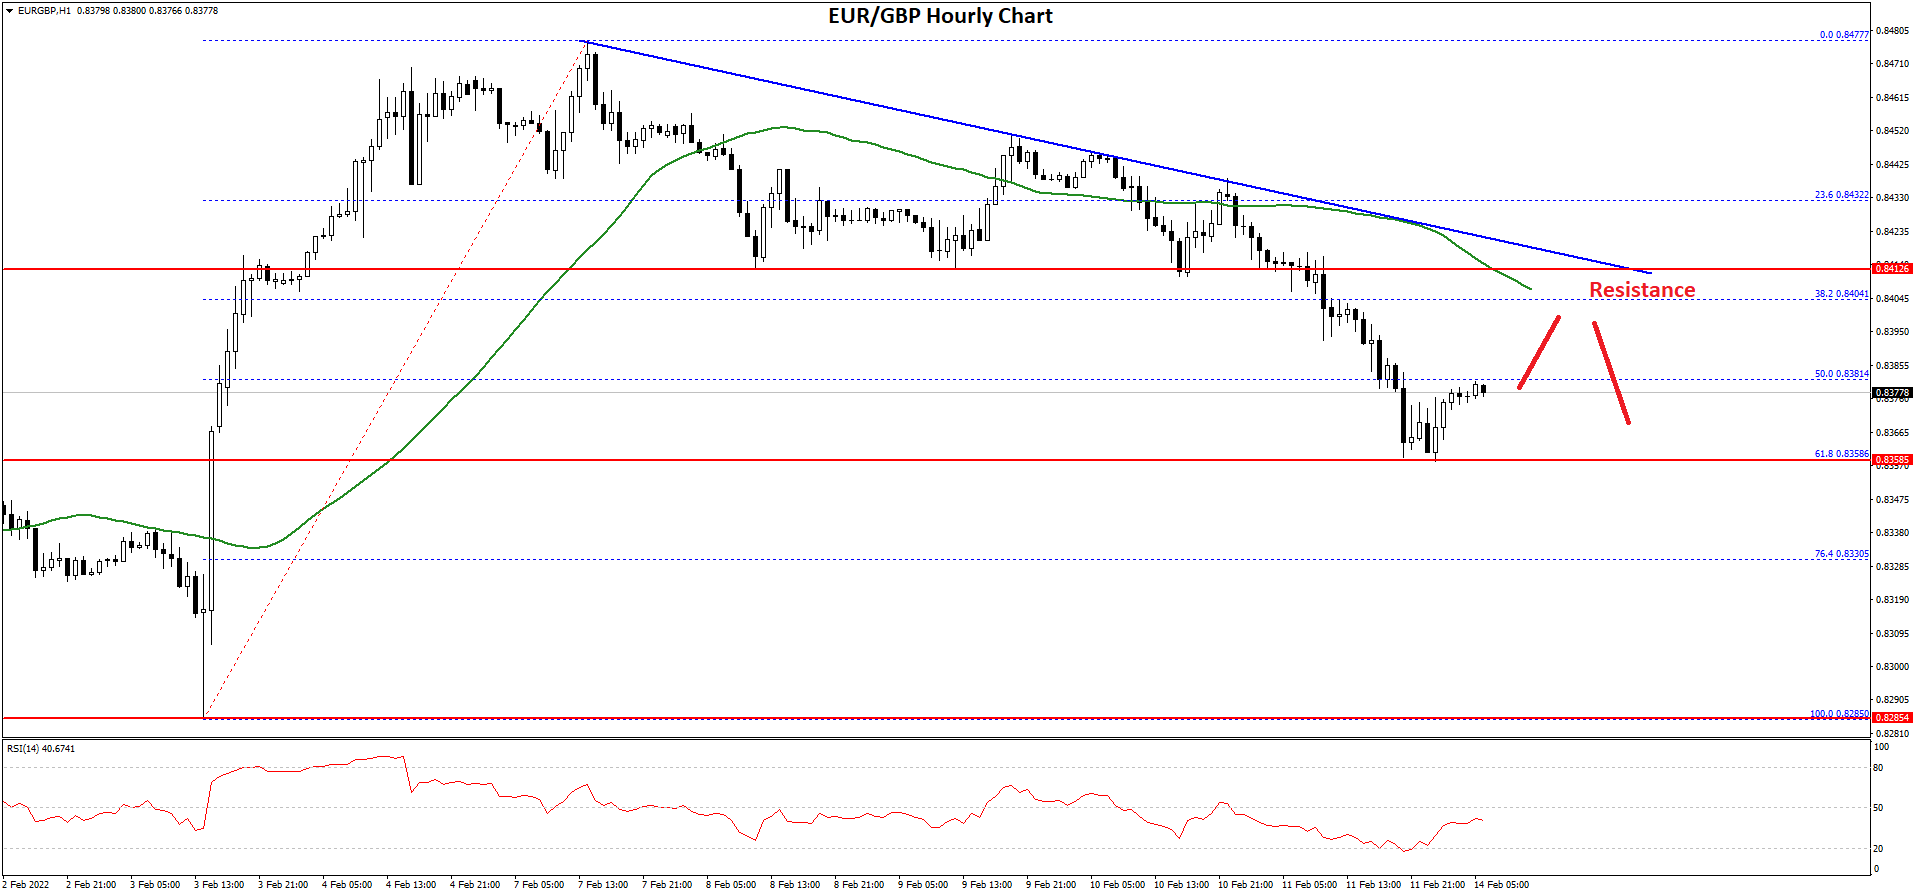
It even spiked below the 0.8400 level. There was a test of the 61.8% Fib retracement level of the upward move from the 0.8285 swing low to 0.8477 high.
On the downside, an initial support is near the 0.8360 level. The next major support is near 0.8330 level. A downside break below the 0.8330 and 0.8320 support levels might call for more downsides. In the stated case, the pair could decline towards the 0.8250 support level in the near term.
On the upside, the pair is facing resistance near the 0.8400 level. There is also a major bearish trend line forming with resistance near 0.8415 on the hourly chart.
The next major resistance for the bulls is near the 0.8420 level. A clear move above the 0.8420 resistance might push the price higher. The next main resistance on the upside is near the 0.8480 level or the last major swing high at 0.8477.
This forecast represents FXOpen Markets Limited opinion only, it should not be construed as an offer, invitation or recommendation in respect to FXOpen Markets Limited products and services or as financial advice.
Trade over 50 forex markets 24 hours a day with FXOpen. Take advantage of low commissions, deep liquidity, and spreads from 0.0 pips (additional fees may apply). Open your FXOpen account now or learn more about trading forex with FXOpen.
This article represents the opinion of the Companies operating under the FXOpen brand only. It is not to be construed as an offer, solicitation, or recommendation with respect to products and services provided by the Companies operating under the FXOpen brand, nor is it to be considered financial advice.
Stay ahead of the market!
Subscribe now to our mailing list and receive the latest market news and insights delivered directly to your inbox.


Latest articles

GBP/USD Rises Following Bank of England Decision
Yesterday, the Bank of England’s decision had a significant impact on the pound, which strengthened against other currencies. Although the Official Bank Rate remained unchanged at 3.75%, the market was surprised by the “hawkish” signals, which sharply contrasted

S&P 500 Analysis: Index Falls to Year-to-Date Low
As the S&P 500 chart (US SPX 500 mini on FXOpen) shows, the index dropped below the 6,570 level yesterday for the first time in 2026. As a result, the equity market may be on track to