


GBP/USD Surging, USD/CAD Facing Many Hurdles
FXOpen
GBP/USD climbed higher and settled above the 1.3210 resistance level. USD/CAD corrected higher, but it failed to break the key 1.3370 resistance area and later declined.
Important Takeaways for GBP/USD and USD/CAD
- The British Pound gained bullish momentum and traded above the 1.3200 resistance area.
- There is a major bullish trend line formed with support at 1.3270 on the hourly chart of GBP/USD.
- USD/CAD broke a key bearish trend line with resistance at 1.3330 on the hourly chart.
- The pair failed to break the 1.3370 resistance trimmed most its recent gains.
GBP/USD Technical Analysis
The British Pound found a strong buying interest near the 1.2970 and 1.3000 levels against the US Dollar. The GBP/USD pair started a solid upward move and broke the 1.3120 and 1.3200 resistance levels to move into a positive zone.
It even broke the 1.3300 barrier and traded as high as 1.3380 on FXOpen. There was even a close above the 1.3250 level and the 50 hourly simple moving average. Later, there was a downside correction below the 1.3300 and 1.3280 levels.
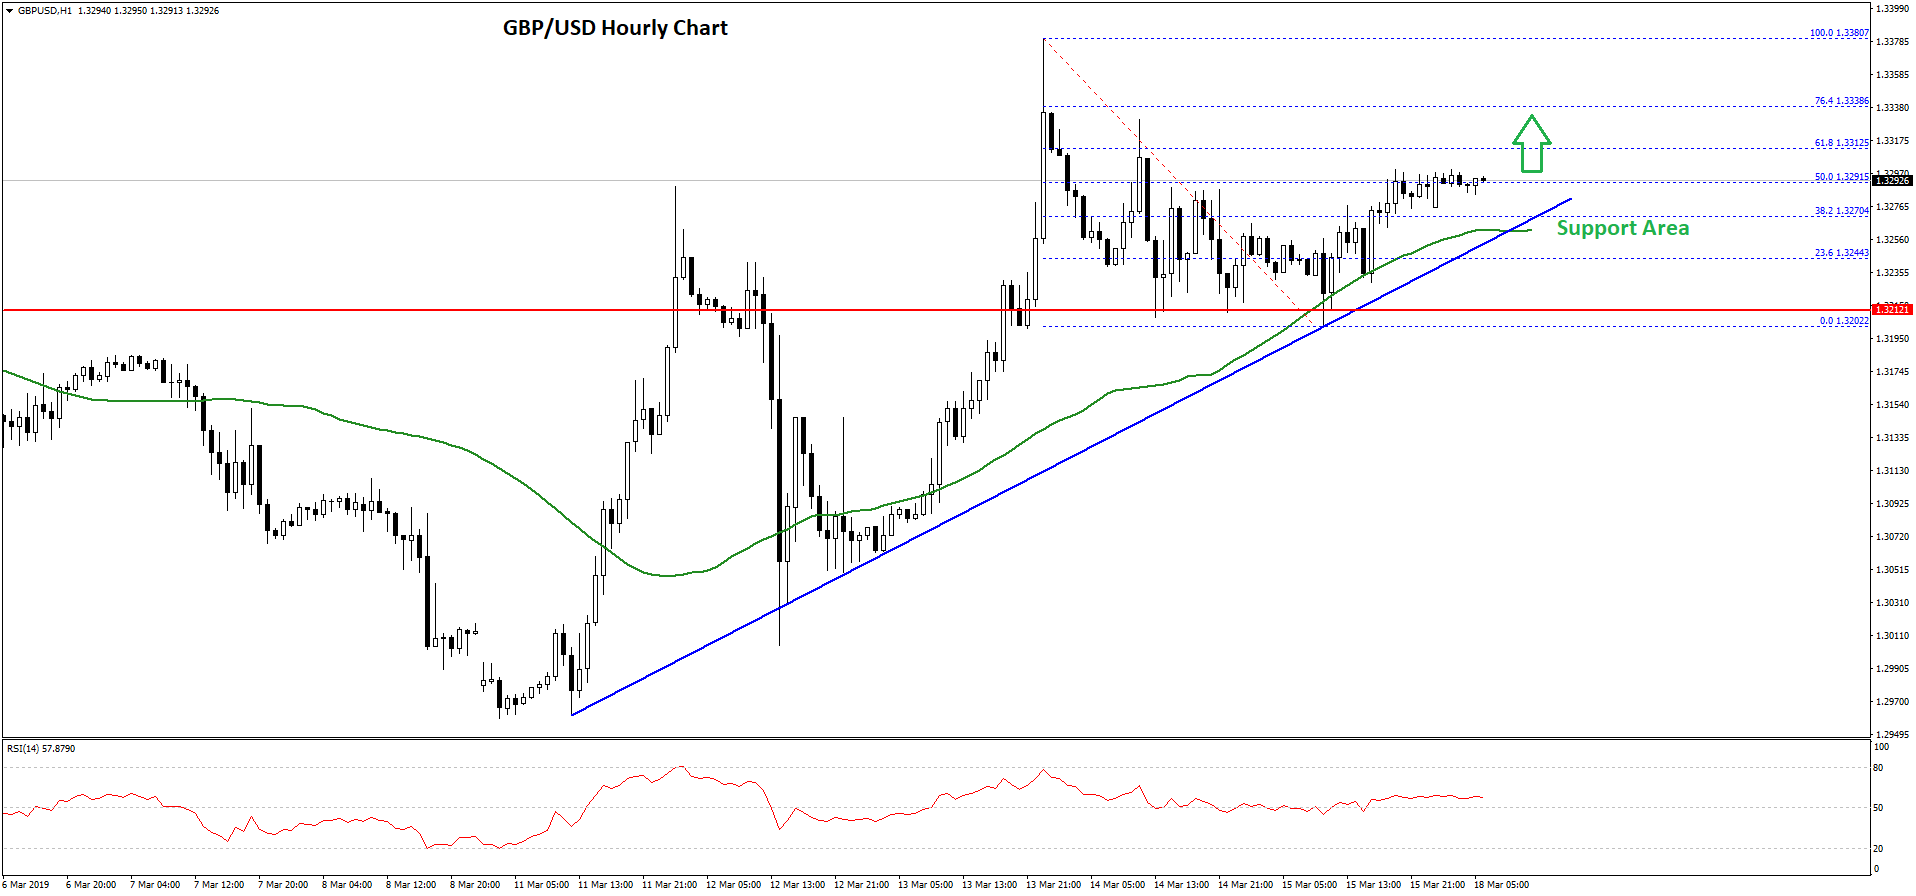
However, the 1.3200-1.3210 area acted as a decent support and prevented further losses. There is also a major bullish trend line formed with support at 1.3270 on the hourly chart of GBP/USD.
The pair moved higher above 1.3250 and the 38.2% Fib retracement level of the last decline from the 1.3380 high to 1.3202 low. The pair also moved above the 1.3280 level, but the 1.3300 level is currently acting as a resistance.
Besides, the pair is struggling to gain strength above the 50% Fib retracement level of the last decline from the 1.3380 high to 1.3202 low. The current price action is positive and suggests that the pair may soon break the 1.3300 and 1.3320 resistance levels.
On the upside, the next key resistance is near the 1.3350 level, above which the pair could revisit the 1.3380 swing high. On the downside, a break below the trend line support at 1.3270 could push the pair back towards the 1.3200 support area.
USD/CAD Technical Analysis
The US Dollar declined heavily and broke the 1.3400 and 1.3350 support levels against the Canadian Dollar. The USD/CAD pair even broke the 1.3300 support level before buyers appeared near the 1.3290 level.
A low was formed at 1.3289 and later the pair formed a solid support base near the 1.3300 level. Finally, there was an upside break above 1.3320 level and a key bearish trend line with resistance at 1.3330 on the hourly chart.
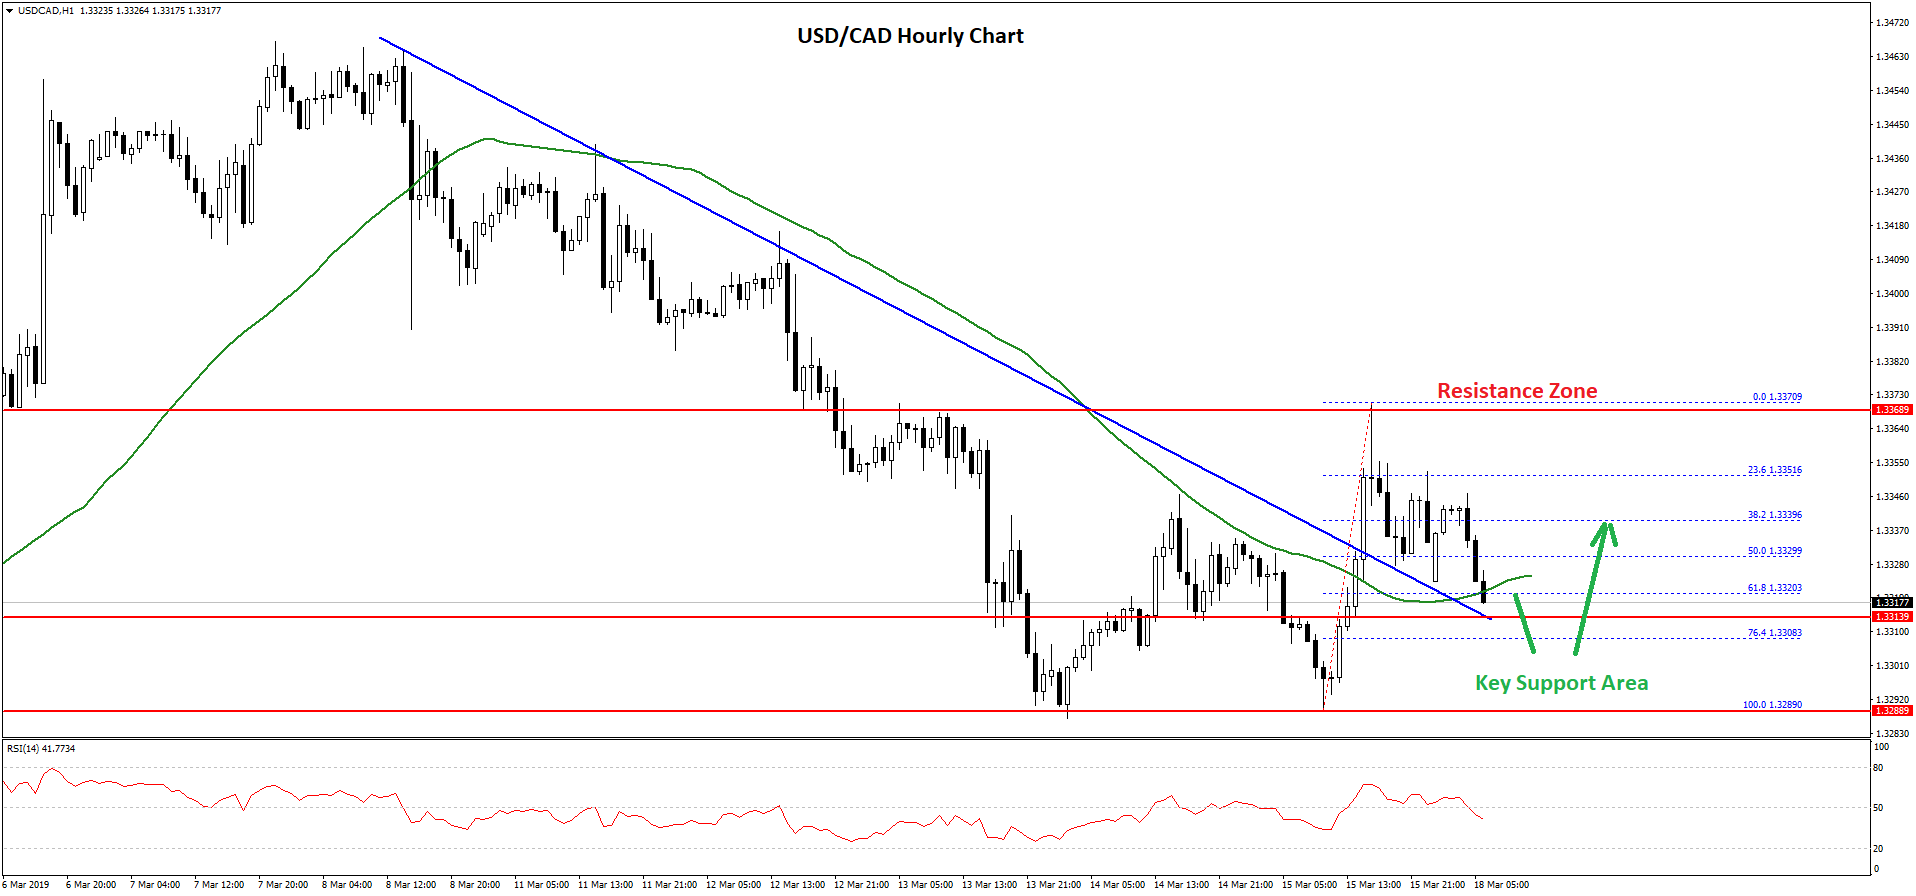
The pair rallied above the 1.3350 level and the 50 hourly simple moving average. However, the 1.3370 level acted as a solid resistance and prevented further gains.
As a result, there was a fresh decline below the 1.3350 level and the 50% Fib retracement level of the last wave from the 1.3289 low to 1.3370 high. The pair even broke the 1.3330 level and retested the 1.3320 support area.
It is currently trading near the 61.8% Fib retracement level of the last wave from the 1.3289 low to 1.3370 high. It seems like USD/CAD could decline further before the 1.3300 support comes into play. As long as the pair is above 1.3300, it could bounce back. If not, the pair may slide sharply towards the 1.3250 level.
Trade over 50 forex markets 24 hours a day with FXOpen. Take advantage of low commissions, deep liquidity, and spreads from 0.0 pips (additional fees may apply). Open your FXOpen account now or learn more about trading forex with FXOpen.
This article represents the opinion of the Companies operating under the FXOpen brand only. It is not to be construed as an offer, solicitation, or recommendation with respect to products and services provided by the Companies operating under the FXOpen brand, nor is it to be considered financial advice.
Stay ahead of the market!
Subscribe now to our mailing list and receive the latest market news and insights delivered directly to your inbox.


Latest articles

EUR/USD Eyes Gains As USD/CHF Weakness Deepens Again
EUR/USD started a fresh increase above 1.1700 and 1.1720. USD/CHF declined further and is now struggling below 0.7835.
Important Takeaways for EUR/USD and USD/CHF Analysis Today
· The Euro started a decent increase from

Apple: Earnings Day Above the Activity Zone
On 30 April, after the market close, Apple Inc. will release its financial results for the second quarter of fiscal 2026. The consensus forecast, based on estimates from 31 analysts, points to revenue of around $109.7 billion, with expected

USD/JPY and USD/CHF Near Key Levels: The Dollar Supported by the Fed
The US dollar continues to trend upwards following the Federal Reserve meeting, drawing support from the regulator’s moderately hawkish stance and comments by Jerome Powell. Markets interpret the Fed’s rhetoric as a signal that restrictive policy is likely