


FXOpen

GBP/USD started a strong increase above the 1.3200 resistance and it is likely to continue higher. EUR/GBP is currently declining and trading in a bearish zone below 0.8950.
Important Takeaways for GBP/USD and EUR/GBP
- The British Pound started a strong increase above the 1.3200 and 1.3250 resistance levels.
- There is a major bullish trend line forming with support near 1.3280 on the hourly chart of GBP/USD.
- EUR/GBP is declining and it broke the key 0.9000 and 0.8950 support levels.
- There is a key bearish trend line forming with resistance near 0.0.8948 on the hourly chart.
GBP/USD Technical Analysis
The British Pound managed to settle above the 1.3200 resistance zone against the US Dollar. The GBP/USD pair broke a major hurdle near the 1.3250 zone to move further into a positive zone.
It even surpassed the 1.3300 resistance and settled well above the 50 hourly simple moving average. It traded as high as 1.3367 on FXOpen and it is currently consolidating gains. An initial support on the downside is near the 1.3320 level.
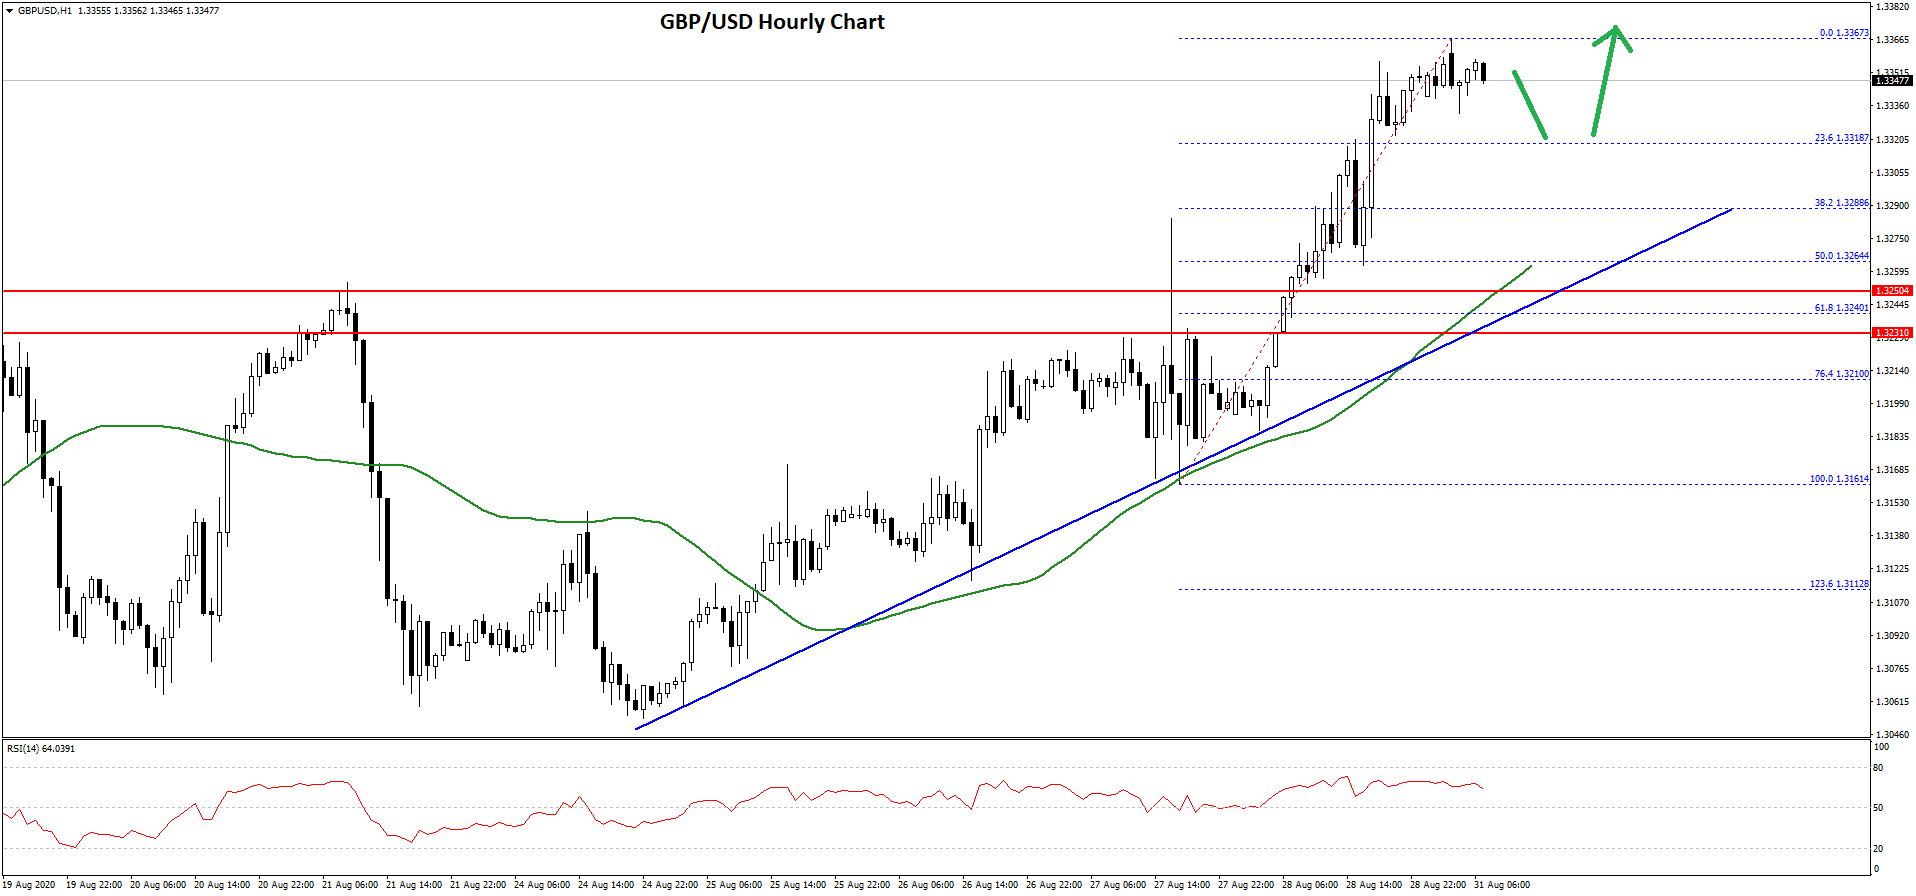
The 23.6% Fib retracement level of the recent rise from the 1.3161 low to 1.3367 high is also near the 1.3318 level to act as a strong support. The next major support is near the 1.3280 level.
There is also a major bullish trend line forming with support near 1.3280 on the hourly chart of GBP/USD. The trend line is close to the 50% Fib retracement level of the recent rise from the 1.3161 low to 1.3367 high.
Therefore, the pair is likely to find a strong buying interest above 1.3280 and 1.3300 if it corrects lower. On the upside, the pair is facing a few short-term hurdles near 1.3380.
A successful close above the 1.3380 level is needed for more gains. In the mentioned case, GBP/USD is likely to clear the 1.3400 level. The next major resistance above 1.3400 is near the 1.3440 level, where the bears might take a stand.
EUR/GBP Technical Analysis
The Euro struggled to follow a similar pattern and it declined from well above 0.9020 against the British Pound. The EUR/GBP pair broke the 0.9000 support level to move into a bearish zone.
The decline was such that the pair even broke the 0.8950 support and settled well below the 50 hourly simple moving average. It traded as low as 0.8908 and it is currently correcting higher.

An initial resistance on the upside is near the 0.8925 level. It is close to the 23.6% Fib retracement level of the recent decline from the 0.8974 swing high to 0.8908 swing low. There is also a key bearish trend line forming with resistance near 0.0.8948 on the hourly chart.
The trend line is close to the 50% Fib retracement level of the recent decline from the 0.8974 swing high to 0.8908 swing low, and the 50 hourly simple moving average. Therefore, the pair must break the 0.8950 resistance and the 50 hourly simple moving average to start a strong recovery.
Conversely, the EUR/GBP pair could continue to move down below the 0.8920 and 0.8900 support levels. The next major support is near the 0.8865 level, where the bulls are likely to take a strong stand.
Trade over 50 forex markets 24 hours a day with FXOpen. Take advantage of low commissions, deep liquidity, and spreads from 0.0 pips. Open your FXOpen account now or learn more about trading forex with FXOpen.
This article represents the opinion of the Companies operating under the FXOpen brand only. It is not to be construed as an offer, solicitation, or recommendation with respect to products and services provided by the Companies operating under the FXOpen brand, nor is it to be considered financial advice.
Stay ahead of the market!
Subscribe now to our mailing list and receive the latest market news and insights delivered directly to your inbox.

Latest from Forex Analysis
Latest articles

Weekly Market Wrap With Gary Thomson: Nasdaq, EUR/USD, USD/CHF, Brent Crude Oil, Googl Shares
Get the latest scoop on the week's hottest headlines, all in one convenient video. Join Gary Thomson, the COO of FXOpen UK, as he breaks down the most significant news reports and shares his expert insights.
- Nasdaq Composite: Worst Session

Analysis of AUD/USD: Exchange Rate Falls to Early May Low
As indicated by the 4-hour AUD/USD chart today:
→ the rate fell below 0.652, a level last seen on May 2;
→ the RSI indicator dropped below 15, a level last seen during the panic over the spread of COVID-19

Analysis of AMZN Stock: Price at 1.5-Month Low
As shown in the AMZN chart, the stock price dropped below:
→ the psychological level of $180;
→ the mid-June interim low.
The last time AMZN traded below $180 was in early June.
Thus, AMZN has faced sell-offs, similar to other tech