


GBP/USD Surging While GBP/JPY Could Decline Further
FXOpen

GBP/USD started a strong increase from the 1.2780 support area and jumped above 1.2950. Conversely, GBP/JPY is declining and it could extend losses below 134.00.
Important Takeaways for GBP/USD and GBP/JPY
- The British Pound is showing a lot of positive signs above the 1.2950 and 1.3000 levels.
- There is a major bullish trend line forming with support near 1.3055 on the hourly chart of GBP/USD.
- GBP/JPY is declining and it recently broke the 136.60 support area.
- There is a key bearish trend line forming with resistance near 136.65 on the hourly chart.
GBP/USD Technical Analysis
This past week, the British Pound started a decent recovery wave from the 1.2780 support area against the US Dollar. The GBP/USD pair broke a few important hurdles near 1.2850 and 1.2925 to move into a positive zone.
Moreover, the pair jumped above the 1.3000 resistance and the 50 hourly simple moving average. The upward move was such that the pair spiked towards the 1.3125 level and a new weekly high is formed at 1.3124 on FXOpen.
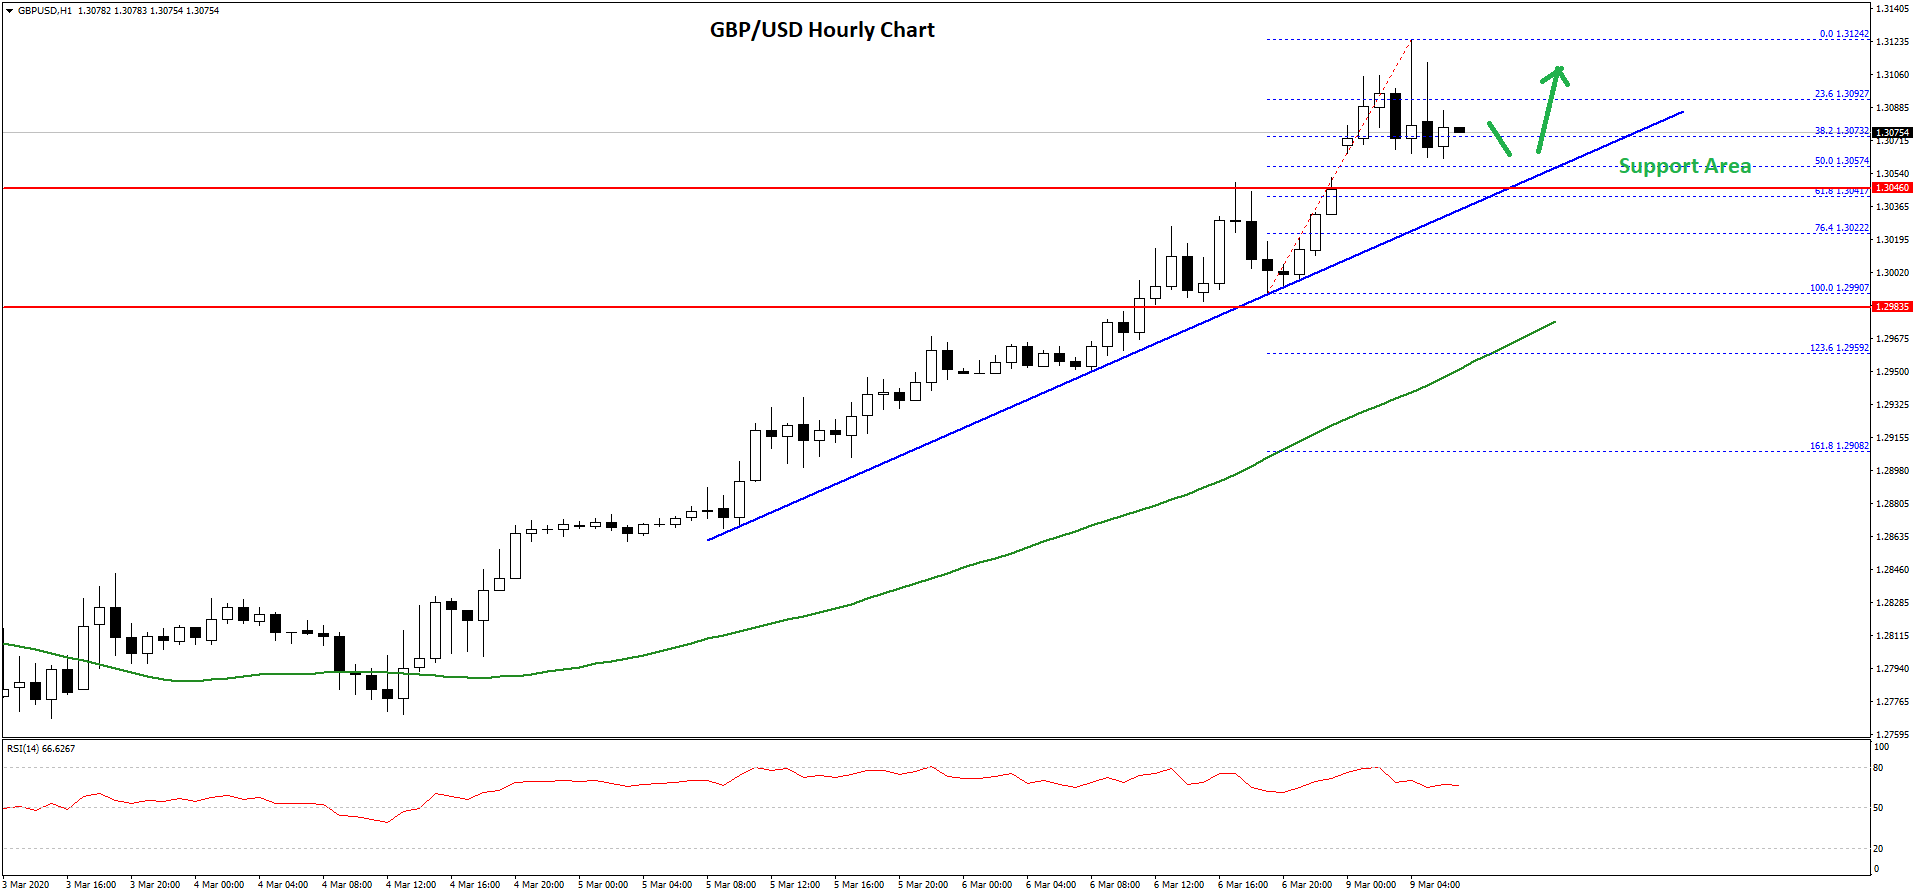
The pair is currently correcting lower below the 1.3100 level. It broke the 23.6% Fib retracement level of the recent wave from the 1.2990 low to 1.3124 high.
However, there are many supports on the downside, starting with the 1.3058 level. It is close to the 50% Fib retracement level of the recent wave from the 1.2990 low to 1.3124 high.
Moreover, there is a major bullish trend line forming with support near 1.3055 on the hourly chart of GBP/USD. Therefore, the pair is likely to remain well supported on the downside near the 1.3050 area.
On the upside, an initial resistance is near the 1.3100 level. The first main hurdle for the GBP/USD pair is near the 1.3120 level, above which the bulls are likely to aim a target of the 1.3150 level in the near term.
GBP/JPY Technical Analysis
The British Pound remained in a bearish zone below the 140.00 pivot level against the Japanese Yen. The GBP/JPY pair broke a few important supports near the 136.80 and 136.60 levels to enter a bearish zone.
It opened the doors for more losses and the pair declined below the 135.00 support level and the 50 hourly simple moving average. Finally, the pair spiked below the 133.00 level and traded as low as 132.91.
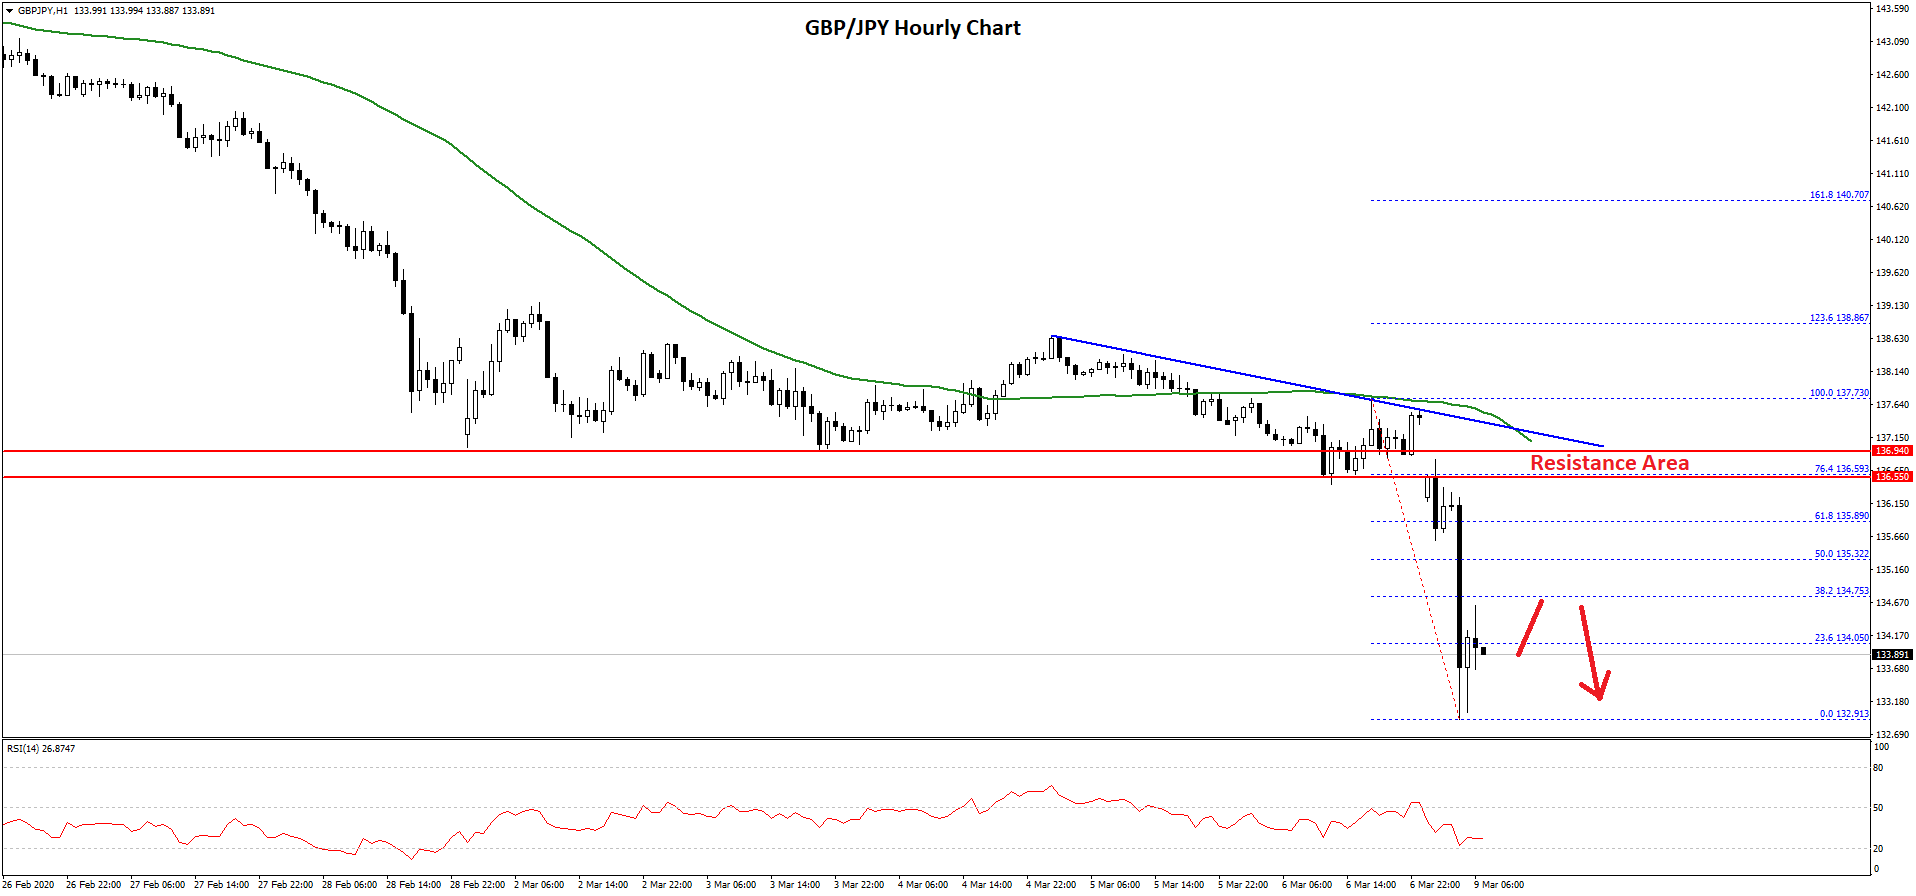
It is currently consolidating losses and trading near the 23.6% Fib retracement level of the recent decline from the 137.73 high to 132.91 low.
On the upside, an initial hurdle for the bulls is near the 135.35 level. It is close to the 50% Fib retracement level of the recent decline from the 137.73 high to 132.91 low.
The main resistance is near the 136.60 and 136.80 levels (the recent breakdown levels). More importantly, there is a key bearish trend line forming with resistance near 136.65 on the hourly chart.
Therefore, the pair is likely to face a lot of hurdles if it corrects higher toward the 136.00 area. On the downside, an initial support is near the 133.00 level.
If the GBP/JPY pair breaks the 133.00 support area, it could open the doors for a larger decline below the 132.50 and 132.20 levels in the near term.
Trade over 50 forex markets 24 hours a day with FXOpen. Take advantage of low commissions, deep liquidity, and spreads from 0.0 pips (additional fees may apply). Open your FXOpen account now or learn more about trading forex with FXOpen.
This article represents the opinion of the Companies operating under the FXOpen brand only. It is not to be construed as an offer, solicitation, or recommendation with respect to products and services provided by the Companies operating under the FXOpen brand, nor is it to be considered financial advice.
Stay ahead of the market!
Subscribe now to our mailing list and receive the latest market news and insights delivered directly to your inbox.


Latest articles

Pound at Key Levels: Markets Assess Impact of Political Uncertainty in the UK
The British pound remains under pressure following increased political uncertainty in the United Kingdom triggered by the Prime Minister’s resignation. Investors are assessing potential shifts in the political and economic policy outlook after the head of government stepped down,

Silver: Fed Tightens Its Tone as Price Returns to the Volume Profile Zone
Silver came under pressure following the Federal Reserve’s June meeting, at which policymakers kept interest rates unchanged at 3.50–3.75%. Nine of the 18 committee members still see the possibility of a rate increase this year, reinforcing

Ethereum: Market Assesses the Strength of the Corrective Recovery
Following a period of heightened volatility in early June, investor attention in Ethereum has once again shifted towards institutional demand and the development of the spot ETF market in the United States. The funds launched last year continue to serve