


GBP/USD Takes A Hit, USD/CAD Eyes More Gains
FXOpen
GBP/USD started a major decline below the 1.3000 support. USD/CAD gained bullish momentum for a move above the 1.2650 level.
Important Takeaways for GBP/USD and USD/CAD
· The British Pound started a fresh decline from the 1.3100 resistance zone.
· There is a short-term bearish trend line forming with resistance near 1.2820 on the hourly chart of GBP/USD.
· USD/CAD started a fresh increase from well below the 1.2550 zone.
· There was a break above a major bearish trend line with resistance near 1.2550 on the hourly chart.
GBP/USD Technical Analysis
After struggling to clear the 1.3100 resistance zone, the British Pound found started a fresh decline against the US Dollar. GBP/USD traded below the 1.3000 support level to move into a bearish zone.
The bears gained strength for a move below the 1.2900 level and the 50 hourly simple moving average. The pair even spiked below the 1.2800 level and traded as low as 1.2793 on FXOpen. It is now consolidating above the 1.2800 level.
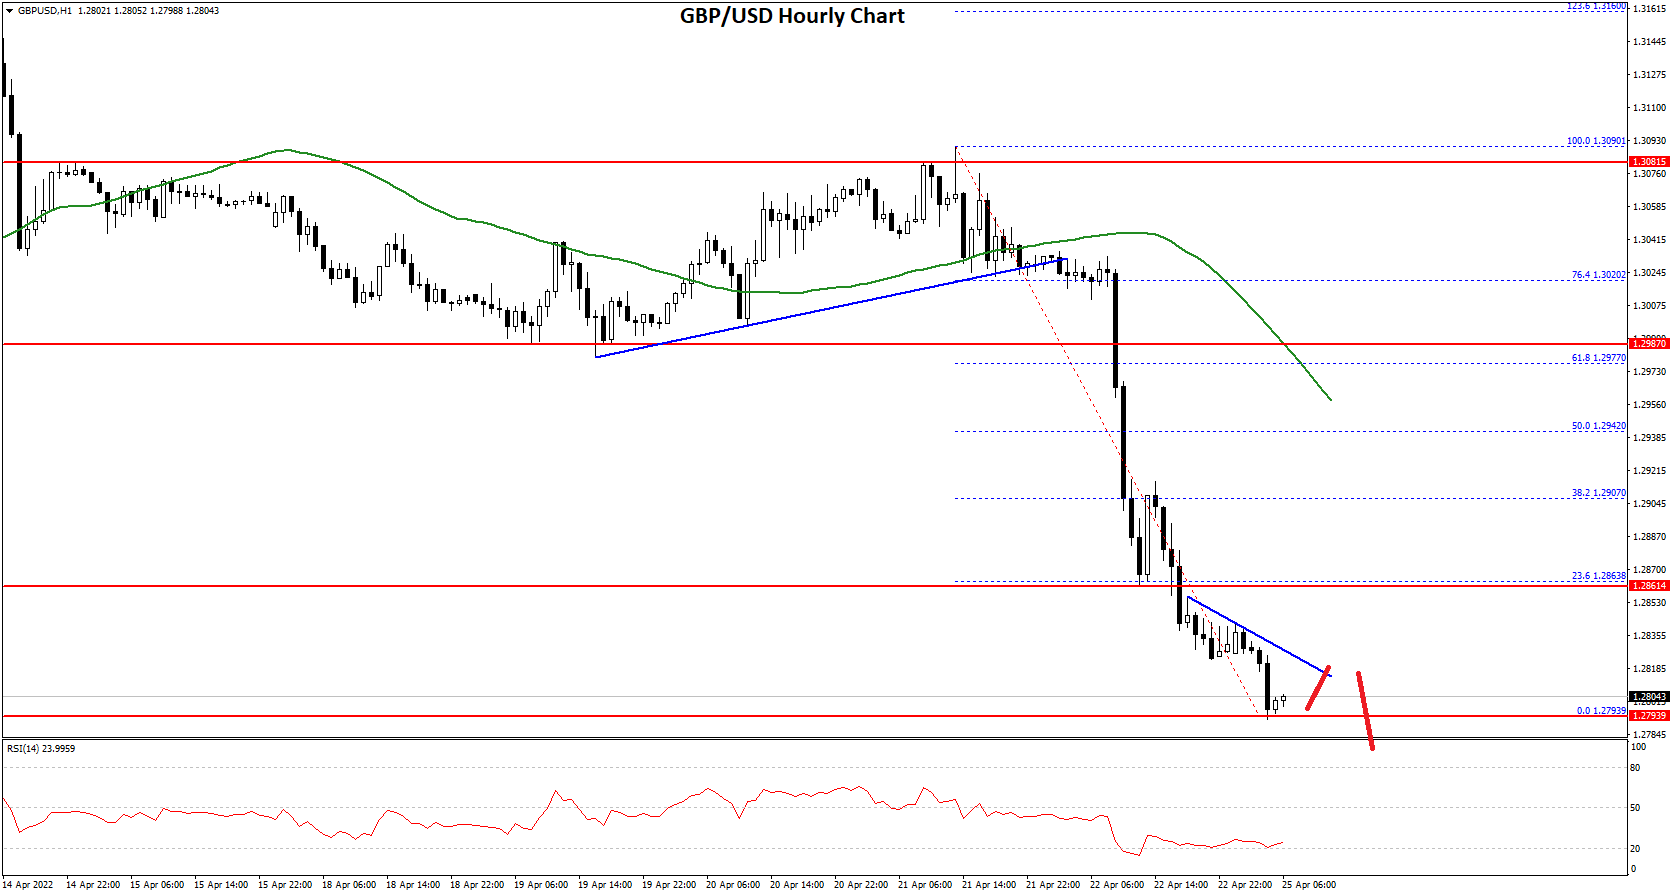
An immediate resistance is near the 1.2820 level. There is also a short-term bearish trend line forming with resistance near 1.2820 on the hourly chart of GBP/USD.
The next key resistance is near the 1.2860 level. It is near the 23.6% Fib retracement level of the downward move from the 1.3090 swing high to 1.2793 low. The first major resistance is near the 1.2940 level.
The 50% Fib retracement level of the downward move from the 1.3090 swing high to 1.2793 low is also near the 1.2940 level. If there is an upside break above the 1.2940 zone, the pair could rise towards 1.3000. The next key resistance could be 1.3050, above which the pair could gain strength.
On the downside, the first support is near the 1.2800 area. The first major support is near the 1.2750 level. If there is a break below 1.2750, the pair could extend its decline. The next key support is near the 1.2625 level. Any more losses might call for a test of the 1.2550 support.
USD/CAD Technical Analysis
The US Dollar started a fresh increase from the 1.2465 zone against the Canadian Dollar. USD/CAD gained pace for a move above the 1.2550 resistance zone.
The pair settled above the 1.2600 level and the 50 hourly simple moving average. There was a break above a major bearish trend line with resistance near 1.2550 on the hourly chart. The pair even climbed above the 1.2700 level. It traded as high as 1.2742 and is currently correcting lower.
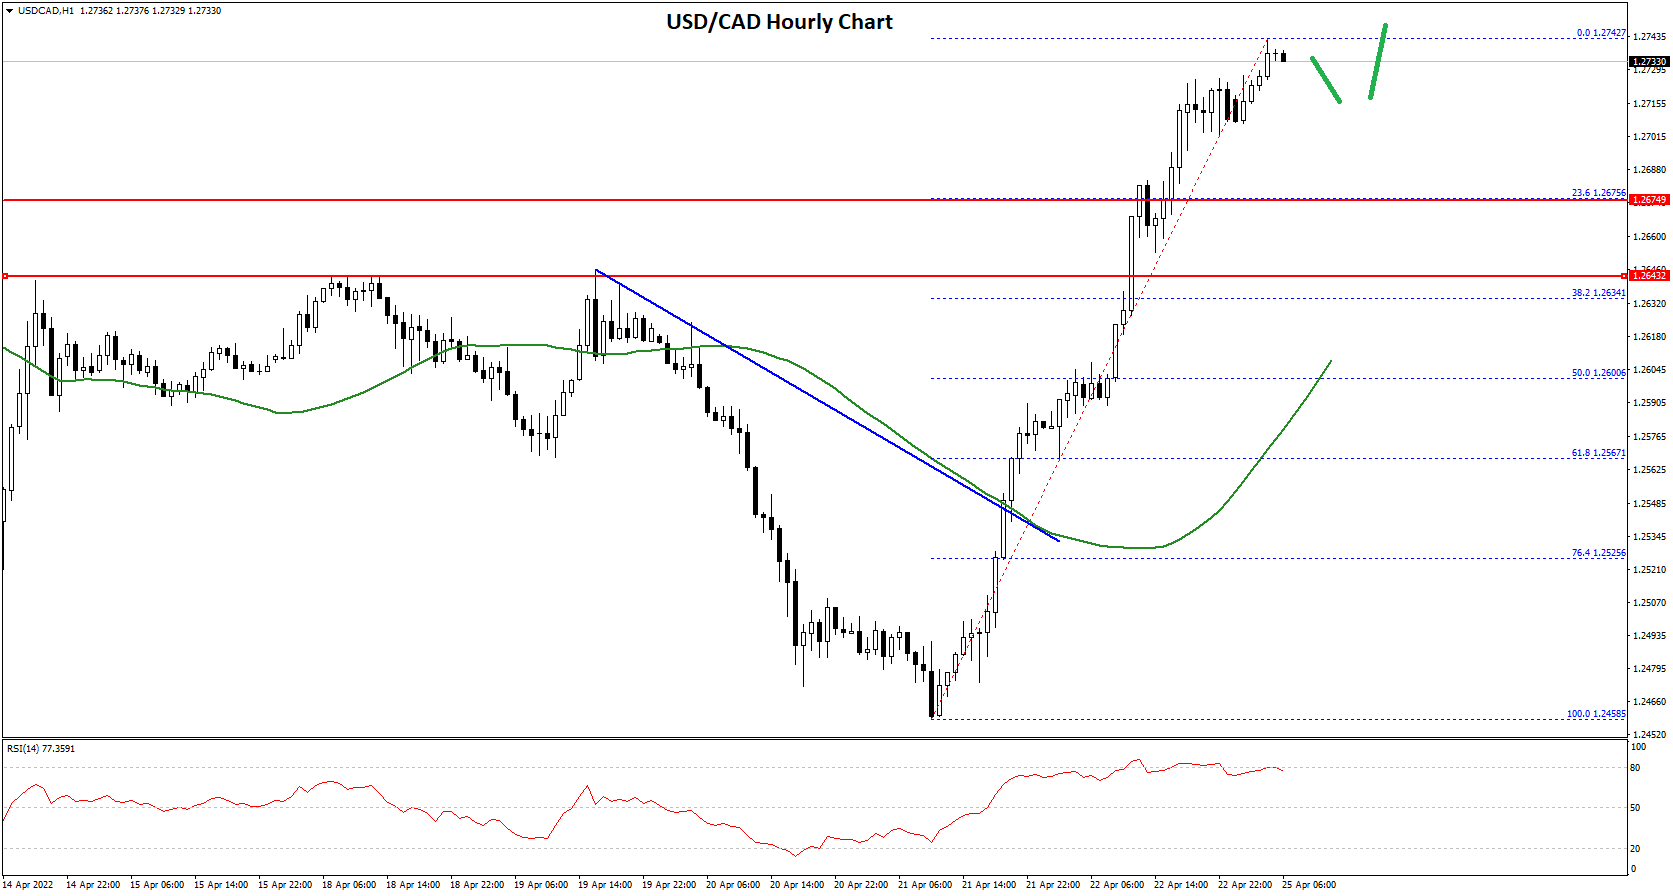
There was a move below the 1.2730 support level. An immediate support is near the 1.2700 level. The first major support is near the 1.2675 level. It is near the 23.6% Fib retracement level of the upward move from the 1.2458 swing low to 1.2742 high.
Any more losses may possibly open the doors for a drop towards the 1.2600 support and the 50 hourly simple moving average. It is near the 50% Fib retracement level of the upward move from the 1.2458 swing low to 1.2742 high.
An immediate hurdle on the upside is near the 1.2740 level. The next major resistance is near the 1.2780 level. A clear break above the 1.2780 level could open the doors for more gains. The next major resistance is near the 1.2850 level.
This forecast represents FXOpen Markets Limited opinion only, it should not be construed as an offer, invitation or recommendation in respect to FXOpen Markets Limited products and services or as financial advice.
Trade over 50 forex markets 24 hours a day with FXOpen. Take advantage of low commissions, deep liquidity, and spreads from 0.0 pips (additional fees may apply). Open your FXOpen account now or learn more about trading forex with FXOpen.
This article represents the opinion of the Companies operating under the FXOpen brand only. It is not to be construed as an offer, solicitation, or recommendation with respect to products and services provided by the Companies operating under the FXOpen brand, nor is it to be considered financial advice.
Stay ahead of the market!
Subscribe now to our mailing list and receive the latest market news and insights delivered directly to your inbox.


Latest articles

WTI Analysis: Gap Breaks Short-Term Trend as Price Remains Trapped Between the POC and Profile Boundary
WTI crude oil plunged by more than 7% on 27 July 2026 after the US suspended a series of strikes against Iran over the weekend, raising hopes of a diplomatic solution and the reopening of shipping through the Strait of

US Dollar Index: A Defining Week for the King of the Markets
The dollar heads into a pivotal week trading near 101.80, just off a 15-month high, with the Fed's July 29 meeting standing as the clear focal point. Markets currently price roughly a 65% chance of a hold, though renewed

NZD/USD: Inflation Surge Meets Strong US Dollar Pressure
On 21 July, Stats NZ reported an acceleration in inflation: the Consumer Price Index rose 1.5% in the second quarter, while the annual inflation rate climbed to 4.1%, its highest level in more than two years and slightly