


FXOpen
GBP/USD declined recently below the 1.3215 and 1.3145 support levels to move into a bearish zone. On the other hand, EUR/GBP broke the 0.8780 resistance to climb above 0.8800.
Important Takeaways for GBP/USD and EUR/GBP
- The British Pound topped near the 1.3255-60 zone and declined recently.
- There was a break below two bullish trend lines with support at 1.3215 and 1.3145 on the hourly chart of GBP/USD.
- EUR/GBP broke a contracting triangle with resistance at 0.8765 on the hourly chart.
- The pair is placed nicely above the 0.8770-80 support area for more gains in the near term.
GBP/USD Technical Analysis
The British Pound climbed higher this past week above the 1.3200 resistance against the US Dollar. The GBP/USD pair even broke the 1.3240 resistance, but it failed to settle above the 1.3250 resistance.
The pair started a downside move after forming a top near the 1.3257 level. It declined below the 1.3200 support area and broke the 50 hourly simple moving average.
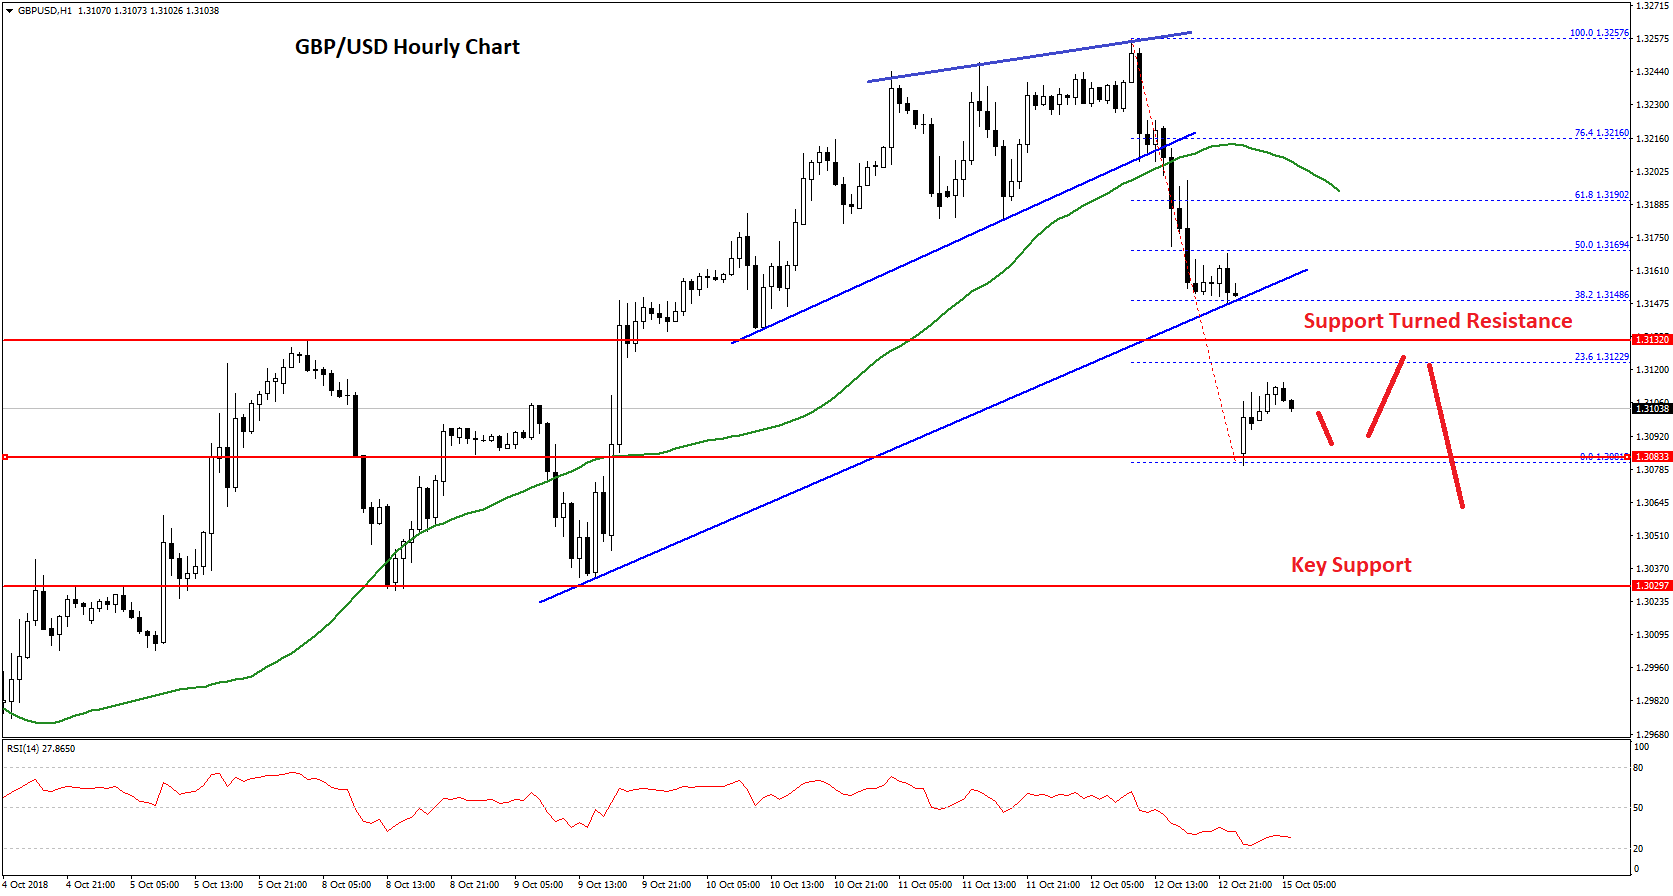
During the decline, there was a break below two bullish trend lines with support at 1.3215 and 1.3145 on the hourly chart. The pair tested the 1.3080 support and it is currently correcting higher. An initial resistance is near the 23.6% Fib retracement level of the last decline from the 1.3257 high to 1.3081 low.
However, the most important resistance on the upside is near the 1.3130-40 zone. Above this, the pair could test the 50% Fib retracement level of the last decline from the 1.3257 high to 1.3081 low at 1.3169, which is likely to act as a strong resistance.
On the downside, an initial support is near the 1.3080 level, below which the pair may continue to decline towards the 1.3030 support area.
Overall, the pair has likely moved into a bearish zone below 1.3145. If there is a break below 1.3080, the GBP/USD pair may possibly accelerate losses in the near term.
EUR/GBP Technical Analysis
The Euro faced a lot of selling pressure this past week and declined below the 0.8800 support against the British Pound. The EUR/GBP pair traded close to the 0.8725 support area where buyers emerged.
The pair formed a decent support above 0.8725 and later started an upward move. It climbed higher and broke the 0.8750 resistance plus the 50 hourly simple moving average.
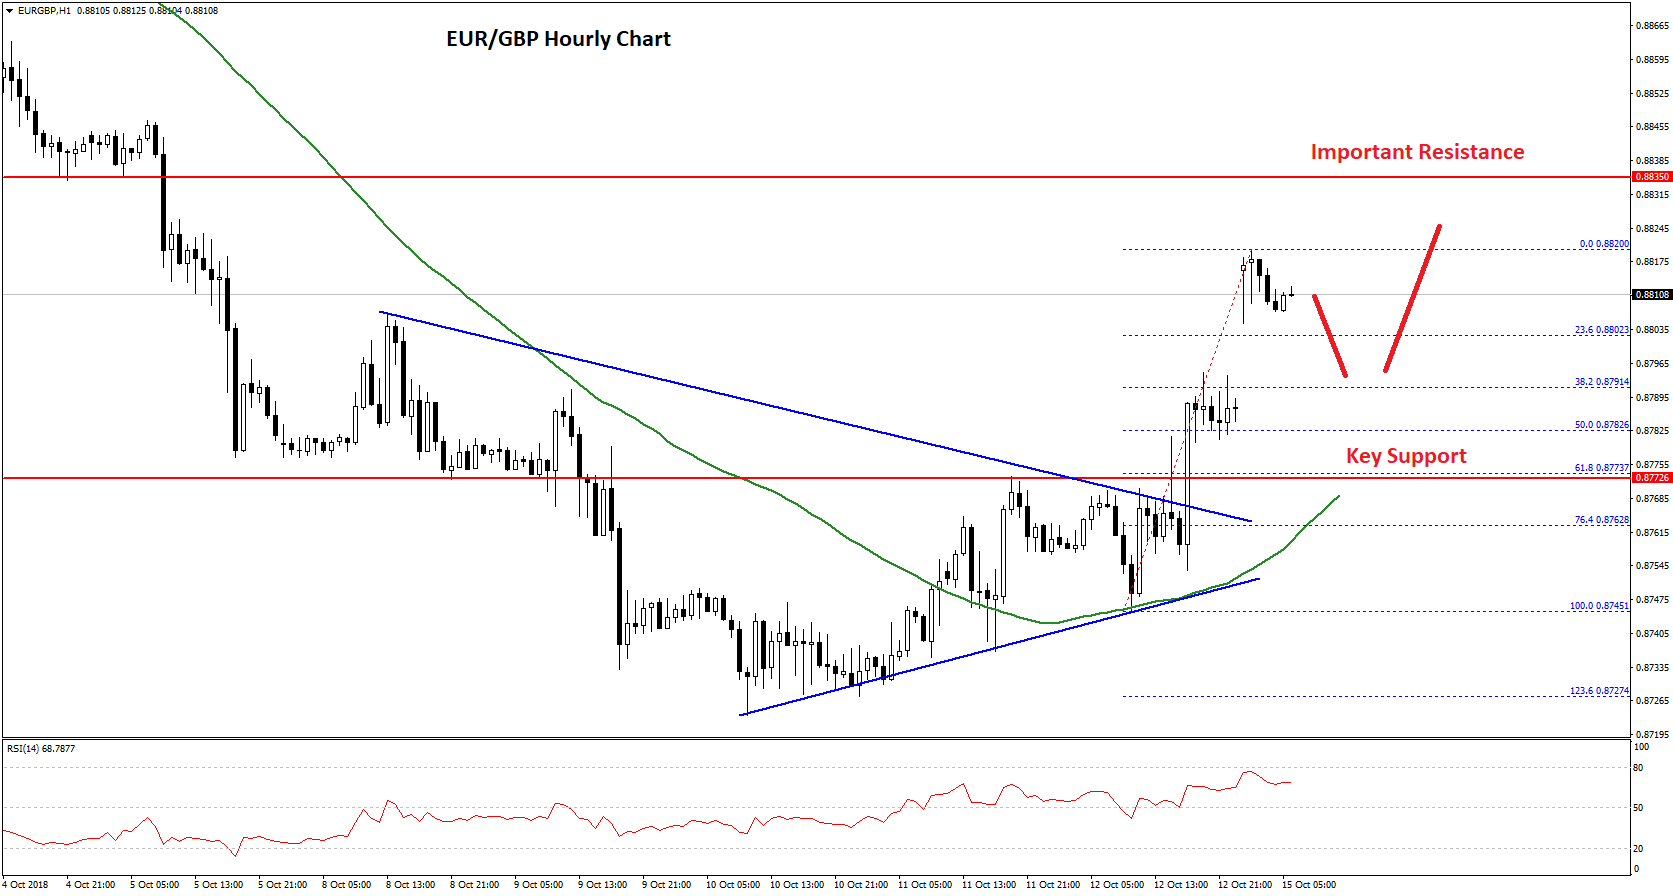
To climb higher, there was a break above a contracting triangle with resistance at 0.8765 on the hourly chart. It opened the doors for more gains and the pair broke the 0.8800 resistance. The pair traded as high as 0.8820 and it is currently consolidating gains.
An initial support is near the 23.6% Fib retracement level of the last wave from the 0.8727 low to 0.8820 high. If the pair corrects below the 0.8800 support, it could test the next major support near the 0.8770-80 area.
The stated 0.8770-80 area was a resistance earlier and now it is likely to protect declines. It also represents the 50% Fib retracement level of the last wave from the 0.8727 low to 0.8820 high.
Therefore, if the pair continues to correct lower, it could find a strong buying interest above 0.8770. On the upside, a break above the 0.8820 high may perhaps push EUR/GBP towards the 0.8850 level in the near term.
Trade over 50 forex markets 24 hours a day with FXOpen. Take advantage of low commissions, deep liquidity, and spreads from 0.0 pips. Open your FXOpen account now or learn more about trading forex with FXOpen.
This article represents the opinion of the Companies operating under the FXOpen brand only. It is not to be construed as an offer, solicitation, or recommendation with respect to products and services provided by the Companies operating under the FXOpen brand, nor is it to be considered financial advice.
Stay ahead of the market!
Subscribe now to our mailing list and receive the latest market news and insights delivered directly to your inbox.

Latest from Forex Analysis
Latest articles

Weekly Market Wrap With Gary Thomson: Nasdaq, EUR/USD, USD/CHF, Brent Crude Oil, Googl Shares
Get the latest scoop on the week's hottest headlines, all in one convenient video. Join Gary Thomson, the COO of FXOpen UK, as he breaks down the most significant news reports and shares his expert insights.
- Nasdaq Composite: Worst Session

Analysis of AUD/USD: Exchange Rate Falls to Early May Low
As indicated by the 4-hour AUD/USD chart today:
→ the rate fell below 0.652, a level last seen on May 2;
→ the RSI indicator dropped below 15, a level last seen during the panic over the spread of COVID-19

Analysis of AMZN Stock: Price at 1.5-Month Low
As shown in the AMZN chart, the stock price dropped below:
→ the psychological level of $180;
→ the mid-June interim low.
The last time AMZN traded below $180 was in early June.
Thus, AMZN has faced sell-offs, similar to other tech