


FXOpen
GBP/USD declined heavily in April and May 2018 after forming a double top pattern around 1.4350. It remains in a downtrend as long as it is below 1.3600. AUD/USD recovered slightly this past month and it recently tested a major resistance at 0.7660.
Important Takeaways for GBP/USD and AUD/USD
- The British Pound has settled below a few important supports such as 1.3700 and 1.3600.
- Recoveries this month are likely to be capped by 1.3600 and 50-day SMA.
- AUD/USD has to settle above 0.7660 and 0.7700 to move back in a bullish zone.
- On the downside, the 0.7500 handle is a major support for buyers.
GBP/USD Technical Analysis
Looking at the larger picture, GBP/USD faced a strong selling interest around the 1.4350-70 zone. The pair formed a double top pattern in April 2018 and started a sharp decline.
It declined and broke many supports on the way down such as 1.4200, 1.4000, 1.3700 and 1.3600. There was also a break below a key bullish trend line with support at 1.4050 on the daily chart.
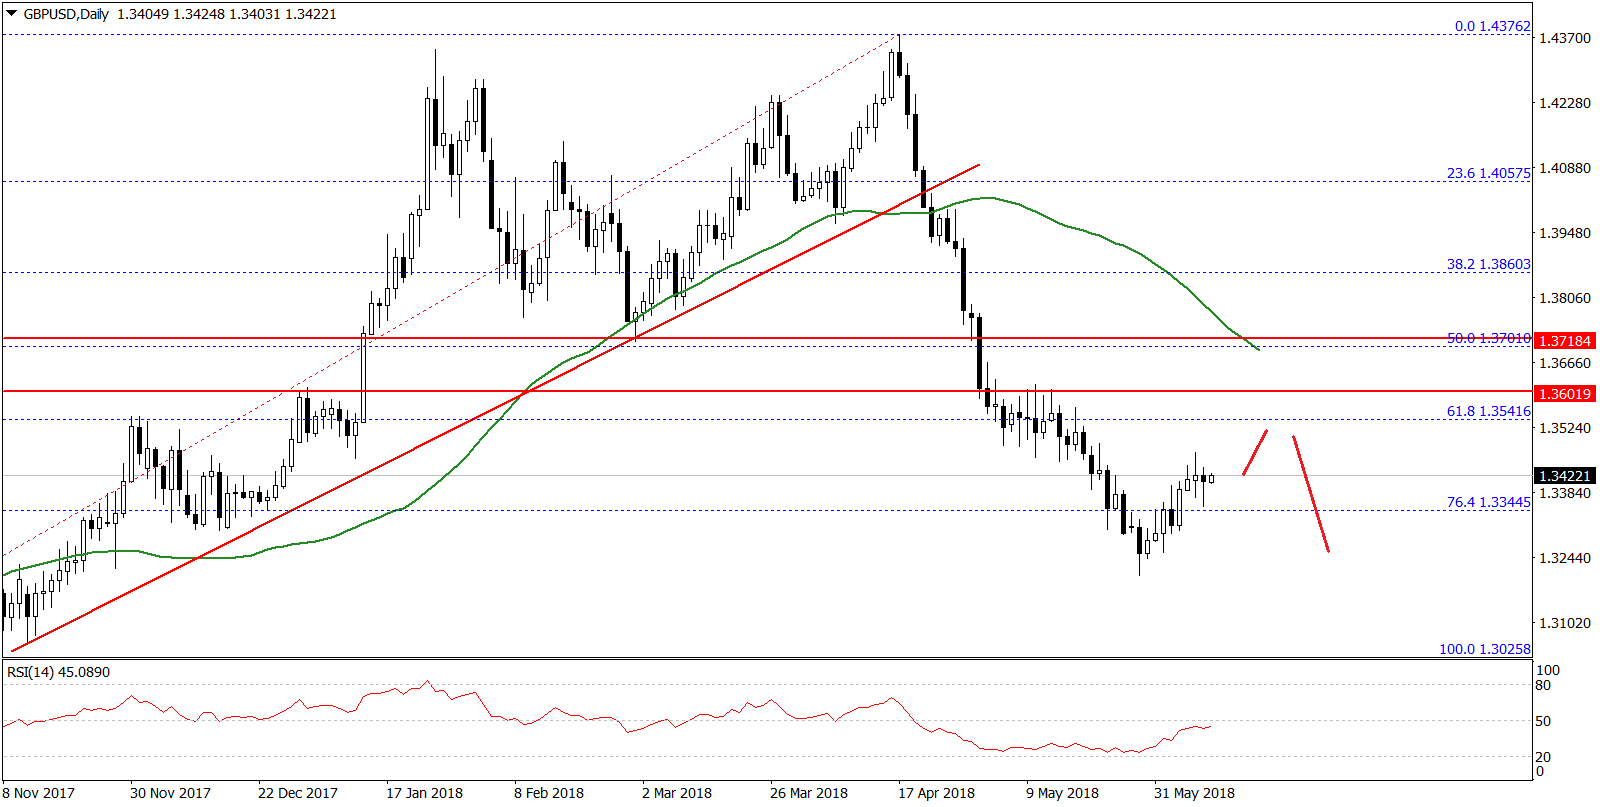
More importantly, there was a break below the 50% Fib retracement level of the last wave from the 1.3025 low to 1.4376 high. The pair settled below the 1.4500 pivot level and the 50-day simple moving average.
These are negative signs and indicates that the pair moved into a bearish zone below 1.3600. There are high chances that the pair could continue to move down towards 1.3050 since there was a break below the 76.4% Fib retracement level of the last wave from the 1.3025 low to 1.4376 high.
Any recoveries from the current levels may perhaps face sellers near 1.3600 and 1.3700. To start a fresh uptrend, the pair has to settle above the 1.3700 hurdle and the 50-day SMA.
AUD/USD Technical Analysis
After a solid decline, the Aussie Dollar found support near 0.7400 during the start of May 2018 against the US Dollar. The AUD/USD pair traded as low as 0.7410 and started an upside correction.
The pair moved above the 23.6% Fib retracement level of the last decline from the 0.7812 high to 0.7410 low. However, the upside move is facing a monster resistance near the 0.7660 level.
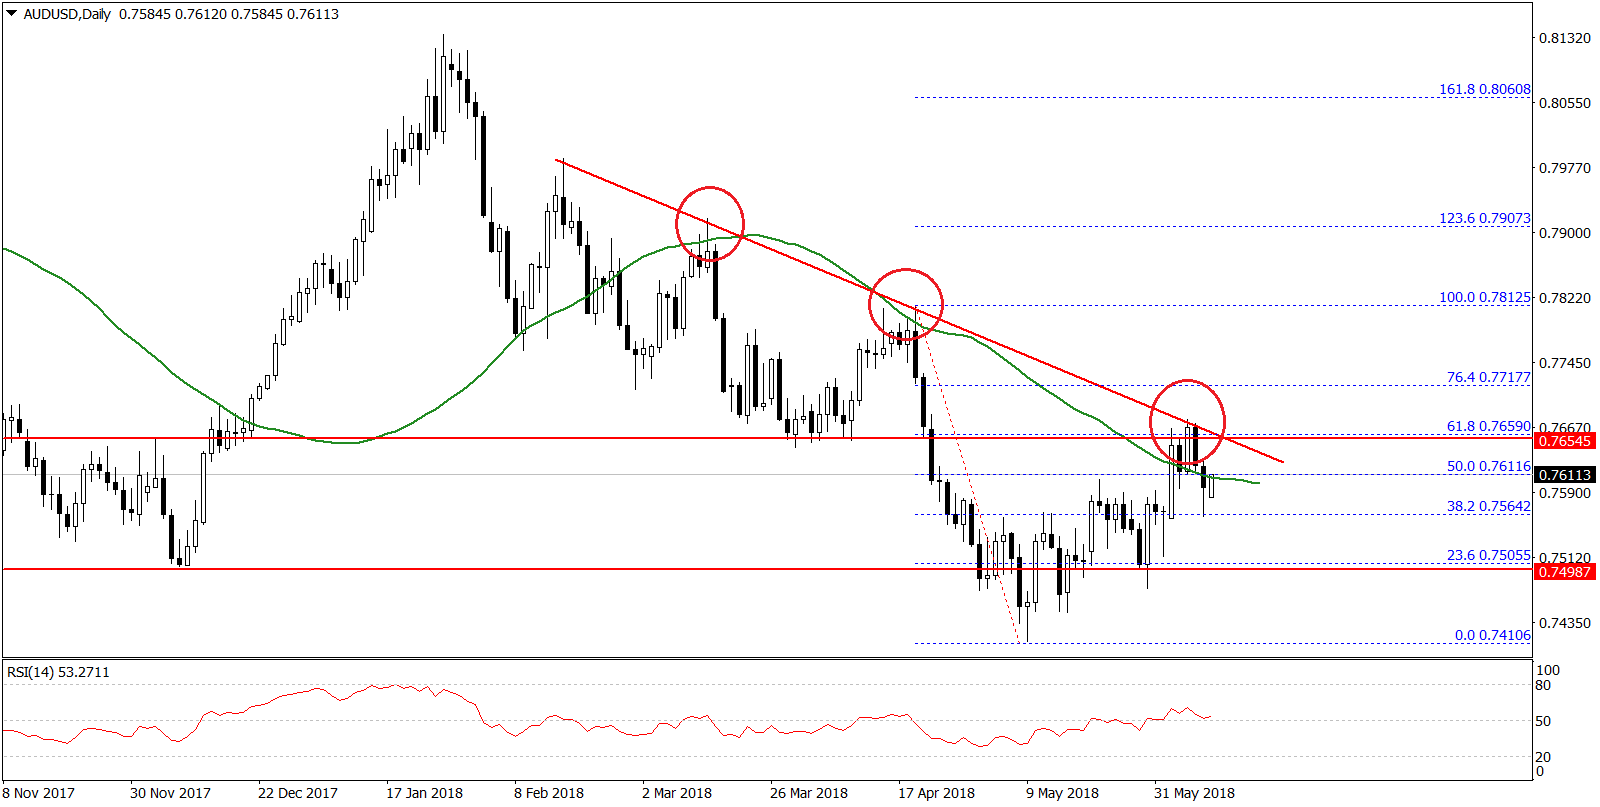
There is a crucial bearish trend line in place with resistance at 0.7670. Moreover, the 61.8% Fib retracement level of the last decline from the 0.7812 high to 0.7410 low is around 0.7660.
Therefore, a break and close above the trend line, 0.7670, and the 50-day SMA is needed for more gains in the near term. Above 0.7670, an immediate hurdle is at 0.7700. Above this last, the pair will most likely surge towards the 0.7800 level.
If the pair fails to move above 0.7700, it could correct lower towards the 0.7550 support. The most important support and a strong pivot zone is at 0.7500, which can be considered as a buy zone this month.
Trade over 50 forex markets 24 hours a day with FXOpen. Take advantage of low commissions, deep liquidity, and spreads from 0.0 pips. Open your FXOpen account now or learn more about trading forex with FXOpen.
This article represents the opinion of the Companies operating under the FXOpen brand only. It is not to be construed as an offer, solicitation, or recommendation with respect to products and services provided by the Companies operating under the FXOpen brand, nor is it to be considered financial advice.
Stay ahead of the market!
Subscribe now to our mailing list and receive the latest market news and insights delivered directly to your inbox.

Latest from Forex Analysis
Latest articles

Weekly Market Wrap With Gary Thomson: Nasdaq, EUR/USD, USD/CHF, Brent Crude Oil, Googl Shares
Get the latest scoop on the week's hottest headlines, all in one convenient video. Join Gary Thomson, the COO of FXOpen UK, as he breaks down the most significant news reports and shares his expert insights.
- Nasdaq Composite: Worst Session

Analysis of AUD/USD: Exchange Rate Falls to Early May Low
As indicated by the 4-hour AUD/USD chart today:
→ the rate fell below 0.652, a level last seen on May 2;
→ the RSI indicator dropped below 15, a level last seen during the panic over the spread of COVID-19

Analysis of AMZN Stock: Price at 1.5-Month Low
As shown in the AMZN chart, the stock price dropped below:
→ the psychological level of $180;
→ the mid-June interim low.
The last time AMZN traded below $180 was in early June.
Thus, AMZN has faced sell-offs, similar to other tech