


GBP/USD and Canadian Dollar Bearish Ahead of US NFP
FXOpen
GBP/USD struggled to break the 1.3350 resistance and moved down. On the other hand, USD/CAD jumped higher and tested the 1.3000 resistance area. Today’s NFP report could impact the market sentiment for both GBP/USD and USD/CAD.
Important Takeaways for GBP/USD and USD/CAD
- The British Pound failed to break an important resistance at 1.3350 and declined.
- There was a break below two bullish trend lines with support at 1.3300 on the hourly chart of GBP/USD.
- USD/CAD climbed higher recently and tested the 1.3000 handle.
- Today, the US nonfarm payroll release for May 2018 is forecasted to register 188K, more than the last reading of 164K.
GBP/USD Technical Analysis
After a heavy decline, the British Pound found support above the 1.3200 handle against the US Dollar. The GBP/USD pair traded as low as 1.3204 and started an upside move.
It traded above the 1.3250 and 1.3300 resistance levels to move into a bullish zone. However, the upside move was capped by a strong resistance at 1.3350. The pair failed near 1.3347 and later it started a fresh downside move.
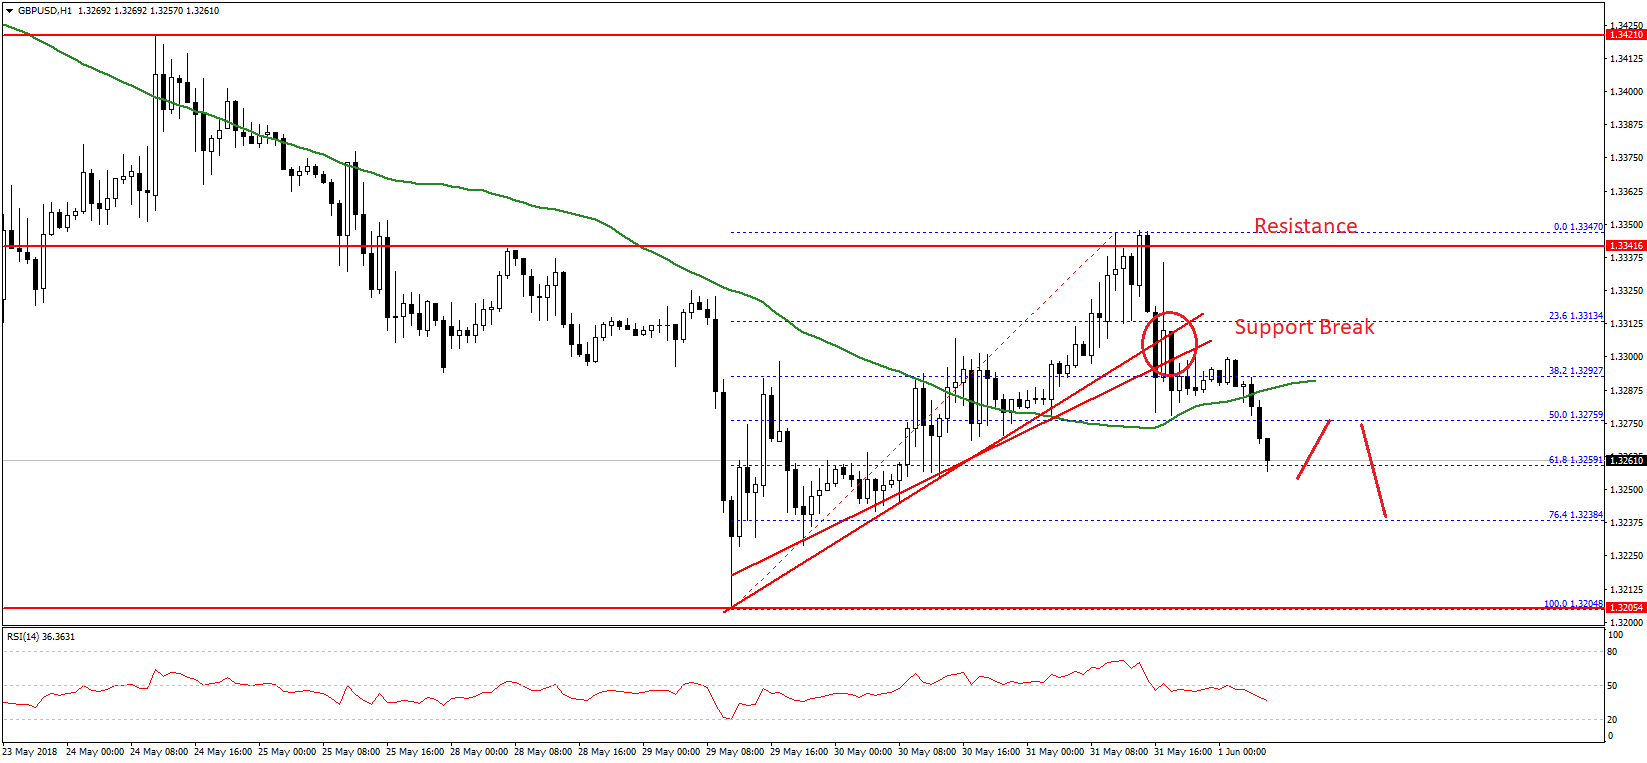
During the decline, it broke the 23.6% Fib retracement level of the last wave from the 1.3204 low to 1.3347 high. More importantly, there was a break below two bullish trend lines with support at 1.3300 on the hourly chart of GBP/USD.
The pair even broke the 50 hourly simple moving average and the 50% Fib retracement level of the last wave from the 1.3204 low to 1.3347 high.
These are negative signs and suggests that the pair may continue to decline in the near term towards the 1.3250 level. Below this, there are high chances of GBP/USD testing the 1.3200 handle.
On the upside, the broken support at 1.3300 and the 50 hourly SMA are seen as resistances, followed by the 1.3350 hurdle.
USD/CAD Technical Analysis
The US Dollar found support near the 1.2820 level this week against the Canadian Dollar. The USD/CAD pair jumped sharply and moved above the 1.2880 and 1.2900 resistance levels.
The upside move was strong as the pair even broke the 1.2950 resistance. It tested the 1.2990-1.3000 resistance zone where sellers took a stand. The pair topped around the 1.2991 level and it is currently correcting lower.
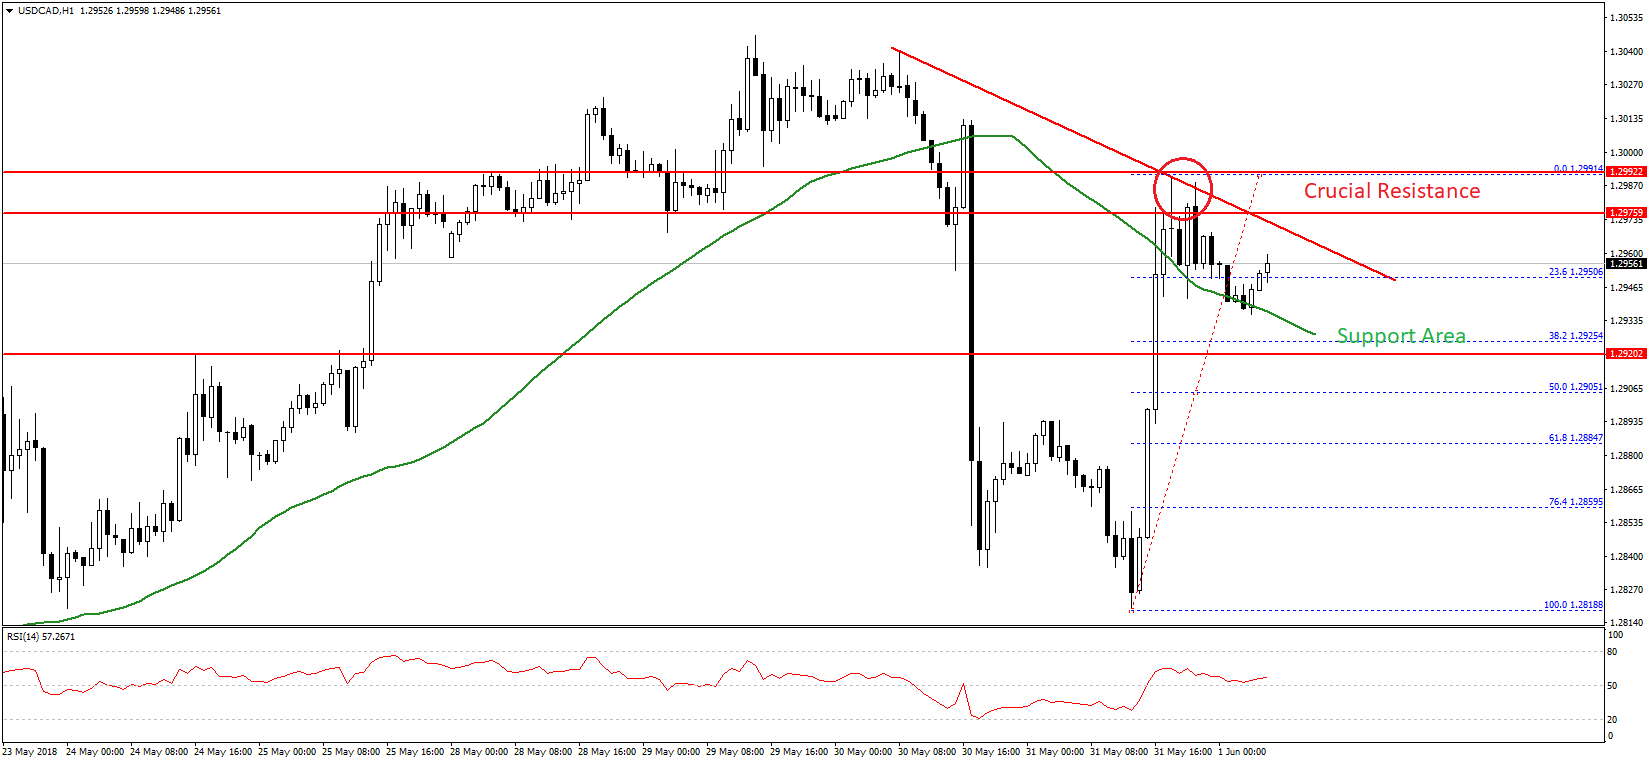
It tested the 50 hourly simple moving average and the 23.6% Fib retracement level of the last wave from the 1.2818 low to 1.2991 high. However, the downside move seems to be limited by the 1.2940 support and the 50 hourly SMA.
On the upside, there is a connecting bearish trend line forming with resistance at 1.2980. A break above this followed by a clear break of 1.3000 is required for more upsides.
On the flip side, if the pair breaks the 1.2940 support, it could test the 50% Fib retracement level of the last wave from the 1.2818 low to 1.2991 high at 1.2905.
Recently in Canada, the Gross Domestic Product report for March 2018 was released by the Statistics Canada. The market was looking for a rise of 0.2% in the GDP (MoM), less than the last 0.4%.
However, the actual result was better as there was a rise in the GDP by 0.3%. The annualized reading was 1.3% in Q1 2018 (QoQ), less than the forecast of 1.8%. Therefore, the result was disappointing and it could weigh on the Canadian dollar in the short term.
Trade over 50 forex markets 24 hours a day with FXOpen. Take advantage of low commissions, deep liquidity, and spreads from 0.0 pips (additional fees may apply). Open your FXOpen account now or learn more about trading forex with FXOpen.
This article represents the opinion of the Companies operating under the FXOpen brand only. It is not to be construed as an offer, solicitation, or recommendation with respect to products and services provided by the Companies operating under the FXOpen brand, nor is it to be considered financial advice.
Stay ahead of the market!
Subscribe now to our mailing list and receive the latest market news and insights delivered directly to your inbox.


Latest articles

Oil Markets: Why Could the Risk Premium Fade
Oil markets have recently reacted to geopolitical developments — but the more important signal may lie in how price action is evolving afterwards.
In this video, we look at why the risk premium in oil could begin to fade, despite ongoing

USD/JPY Builds Positioning Ahead of Signals from the Bank of Japan
USD/JPY dynamics continue to be driven by the persistent yield gap between US and Japanese government bonds. With the Federal Reserve maintaining a relatively hawkish stance and keeping rates elevated as of April 2026, the Bank of Japan remains

Australian Dollar Pulls Back from Highs on Weaker Data
The Australian dollar is undergoing a corrective decline after reaching recent highs, with the current move driven by market reaction to newly released macroeconomic data. Earlier gains in AUD were supported by improving global risk sentiment and steady demand for