


GBP/USD Plunges As UK Industrial Production Misses Expectations
FXOpen
The Great Britain Pound (GBP) extended downside movement against the US Dollar (USD) on Wednesday, dragging the price of GBP/USD to less than 1.6840 following the downbeat economic reports. The sentiment remains bullish due to Higher High in the recent upside rally.
Technical Analysis
As of this writing, the pair is being traded around 1.6831. A support may be noted around the current level, the 50% fib level ahead of 1.6741, the 61.8% fib level and then 1.6692, the swing low of the recent correction wave as demonstrated in the following chart.
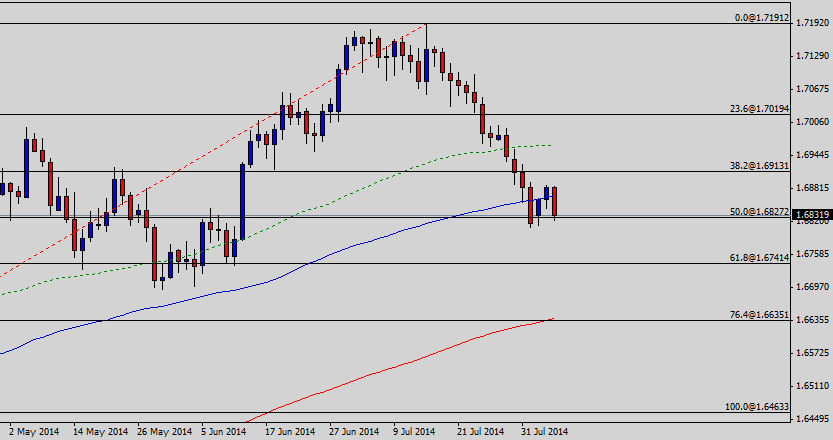
On the upside, the pair is likely to face a hurdle around 1.6913, the 38.2% fib level ahead of 1.7019, the 23.6% fib level and then 1.7191, the swing high of the recent upside rally. The sentiment will remain bullish as far as the 1.6463 support area is intact.
Industrial Production
The industrial production of Britain missed the expectations, printing 1.2% reading in June as compared to 2.3% in the month before against the median projection of 1.5%, a government report revealed today. Generally speaking, higher industrial production is considered positive for the economy, hence the downbeat economic report spurred selling pressure in the price of cable.
US Trade Balance
The US economy witnessed $41.54 billion trade deficit in June as compared to $44.66 billion trade deficit in the month before, a report by the US Bureau of Economic Analysis revealed today which exceeded the expectations of $40.77 billion deficit, accelerating the ongoing selling pressure in the price of GBP/USD.
Conclusion
Considering the overall technical and fundamental outlook, buying the pair around the current levels appears to be a good strategy if the price leaves a bullish engulfing or bullish pin bar on the daily chart. The trade should however be stopped out on a daily closing below the 1.6800 handle.
Trade over 50 forex markets 24 hours a day with FXOpen. Take advantage of low commissions, deep liquidity, and spreads from 0.0 pips (additional fees may apply). Open your FXOpen account now or learn more about trading forex with FXOpen.
This article represents the opinion of the Companies operating under the FXOpen brand only. It is not to be construed as an offer, solicitation, or recommendation with respect to products and services provided by the Companies operating under the FXOpen brand, nor is it to be considered financial advice.
Stay ahead of the market!
Subscribe now to our mailing list and receive the latest market news and insights delivered directly to your inbox.


Latest articles

Amazon Earnings: Does the Chart Already Know Something the Numbers Don't?
All eyes are on July 30, when Amazon reports Q2 2026 earnings, with Wall Street increasingly convinced the bar has been set too low. Consensus sees EPS near $1.82-$2.26 on roughly $197 billion in revenue, but the

WTI Analysis: Gap Breaks Short-Term Trend as Price Remains Trapped Between the POC and Profile Boundary
WTI crude oil plunged by more than 7% on 27 July 2026 after the US suspended a series of strikes against Iran over the weekend, raising hopes of a diplomatic solution and the reopening of shipping through the Strait of

US Dollar Index: A Defining Week for the King of the Markets
The dollar heads into a pivotal week trading near 101.80, just off a 15-month high, with the Fed's July 29 meeting standing as the clear focal point. Markets currently price roughly a 65% chance of a hold, though renewed