


GBP/USD Surging, USD/CAD Remains Under Pressure
FXOpen
GBP/USD is placed nicely above the 1.3250 support for more gains. On the flip side, USD/CAD is likely to extend the current decline below the 1.3070 level.
Important Takeaways for GBP/USD and USD/CAD
- The British Pound surged higher and broke the 1.3200 and 1.3250 resistances versus the US Dollar.
- The GBP/USD pair is following a crucial bullish trend line with support at 1.3255 on the hourly chart.
- USD/CAD broke a key support at 1.3100-10 to move into a bearish zone.
- Canada’s Unemployment Rate jumped from 5.8% to 6.0% in June 2018.
GBP/USD Technical Analysis
There was a solid buying interest above the 1.3100 level for the British Pound against the US Dollar. The GBP/USD pair started a new upward wave and climbed above a few resistance levels such as 1.3200 and 1.3250 to move into a bullish zone.
The pair also settled above the 1.3200 pivot level and the 50 hourly simple moving average. These are positive signs and suggests that the pair may continue to move higher as long as the current trend above 1.3250 is intact.
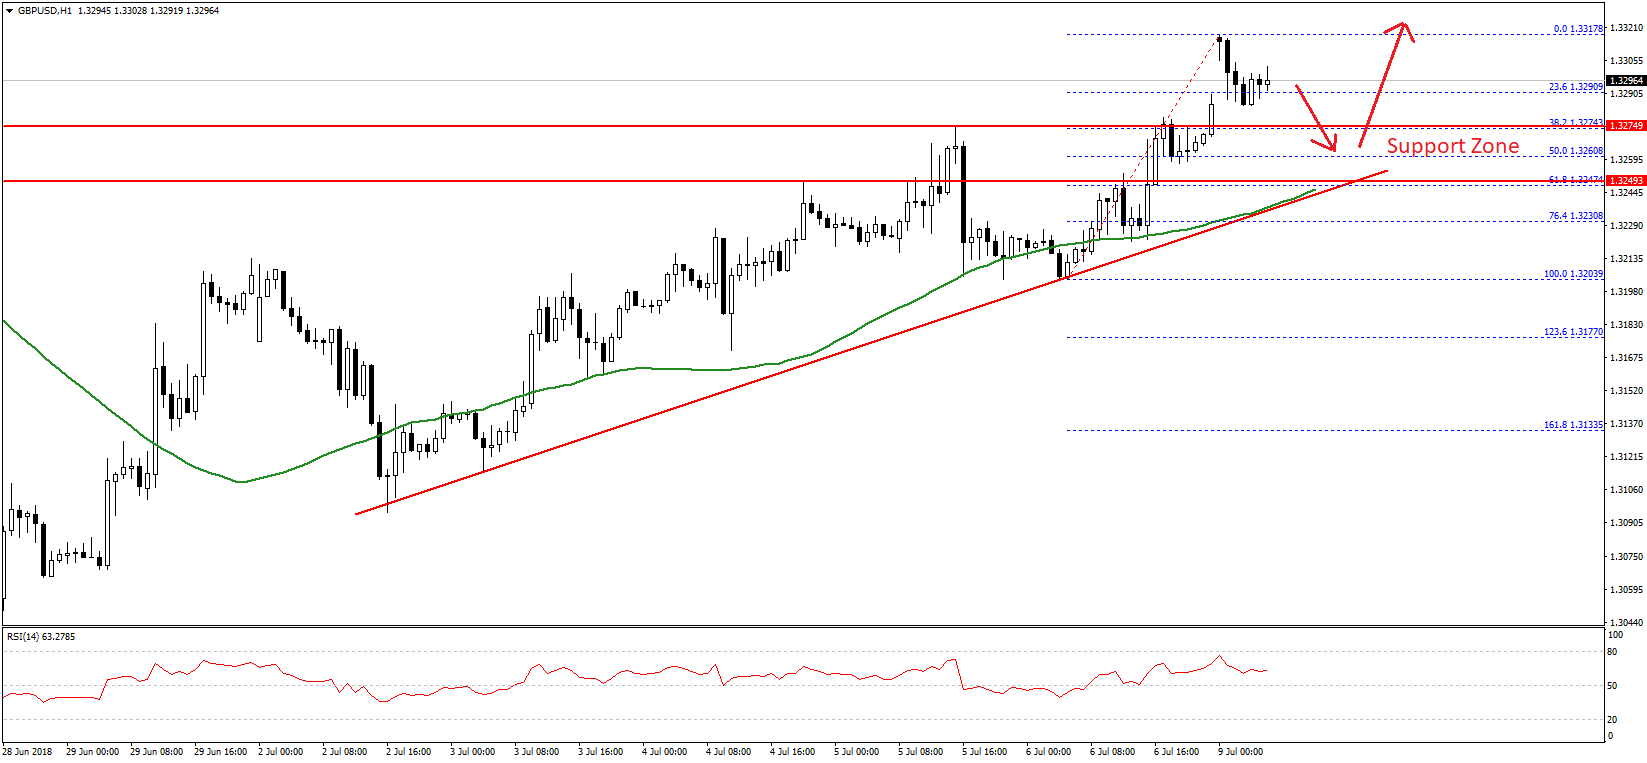
It recently traded as high as 1.3317 and is currently correcting lower. An initial support is around the 23.6% Fib retracement level of the last wave from the 1.3202 low to 1.3317 high.
More importantly, there is a crucial bullish trend line in place with support at 1.3255 on the hourly chart. The same trend line is aligned with the 50 hourly SMA and the 50% Fib retracement level of the last wave from the 1.3202 low to 1.3317 high.
Additionally, the 1.3250-60 zone was a resistance previously, and it could now act as a buy zone. Therefore, if the pair dips from the current levels, it may well find support near the 1.3250-60 zone. Below this, the pair could accelerate declines towards the 1.3200 pivot level.
On the upside, an initial resistance is at 1.3320, above which, the pair might surge towards the 1.3400 handle this week.
USD/CAD Technical Analysis
The US Dollar started a major downside move from well above the 1.3240 level against the Canadian Dollar. The USD/CAD pair declined and settled below the 1.3150 level and the 50 hourly simple moving average.
Buyers fought around the 1.3100-10 zone for a long time, but eventually sellers had the upper hand. The pair declined below the 1.3100 support and moved into a bearish zone. During the decline, it broke the 1.236 Fib extension level of the last wave from the 1.3130 low to 1.3224 high.
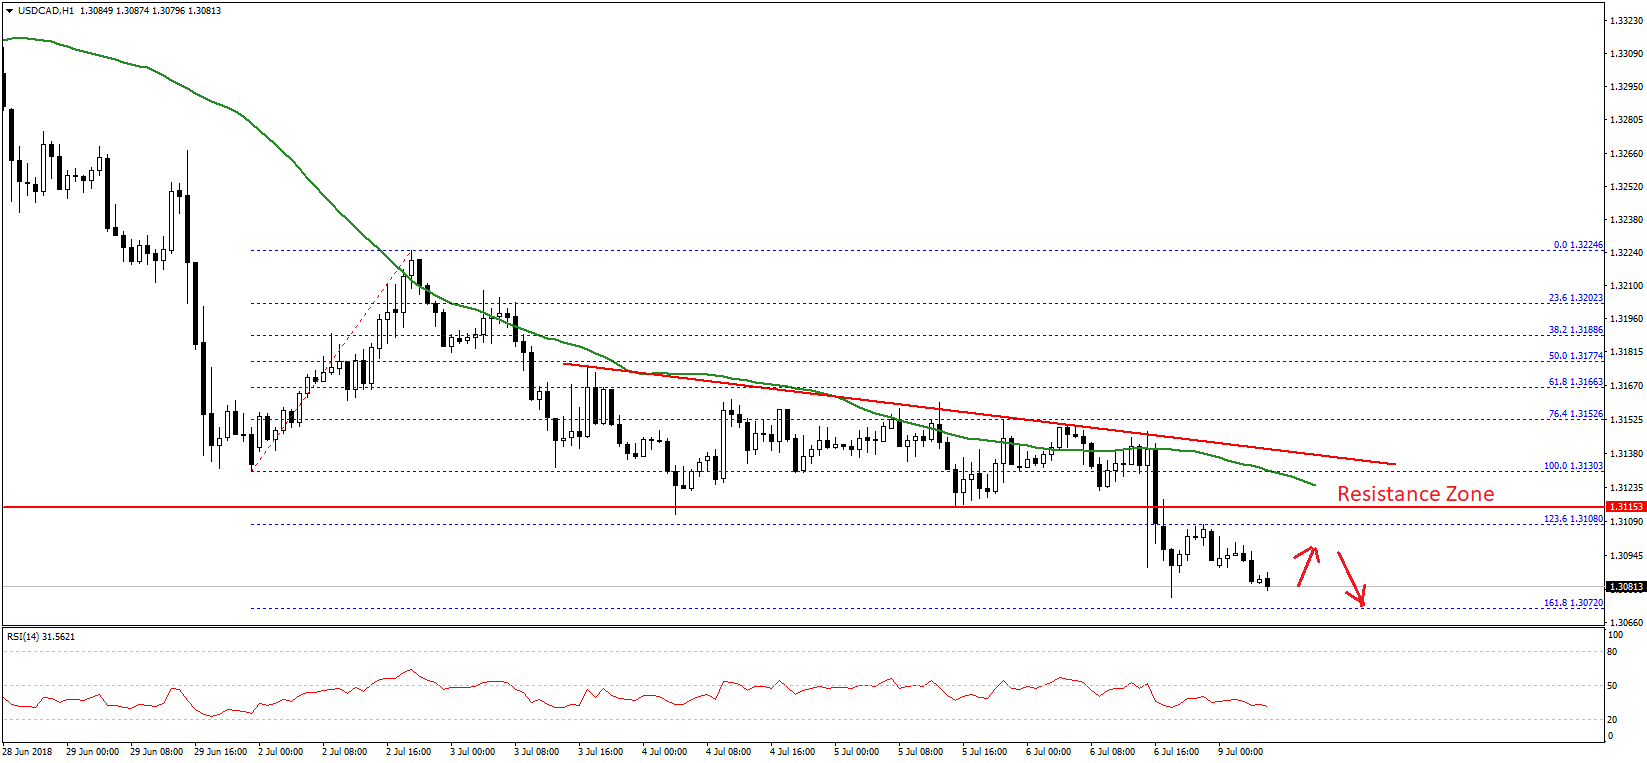
Therefore, there are chances of more declines in the near term towards 1.3070. It could test the 1.618 Fib extension level of the last wave from the 1.3130 low to 1.3224 high. Below 1.3070, the pair may face a lot of selling pressure and it may possibly decline towards the 1.3050 and 1.3020 support levels.
On the upside, the broken support at 1.3100 and 1.3110 are likely to act as resistances. There is also a major bearish trend line in place on the hourly chart with resistance at 1.3135. Therefore, any major correction from the current levels is likely to face hurdles near 1.3100-1.3135.
This past Friday, Canada’s Unemployment Rate for June 2018 was released by the Statistics Canada. The market was looking for no change from 5.8%, but the actual was negative, as there was a rise in the unemployment rate to 6.0%. On the other hand, the employment change was 31.8K, better than the forecast of 24.0K.
Trade over 50 forex markets 24 hours a day with FXOpen. Take advantage of low commissions, deep liquidity, and spreads from 0.0 pips (additional fees may apply). Open your FXOpen account now or learn more about trading forex with FXOpen.
This article represents the opinion of the Companies operating under the FXOpen brand only. It is not to be construed as an offer, solicitation, or recommendation with respect to products and services provided by the Companies operating under the FXOpen brand, nor is it to be considered financial advice.
Stay ahead of the market!
Subscribe now to our mailing list and receive the latest market news and insights delivered directly to your inbox.


Latest articles

DAX 40: consolidation amid technology sell-off
A wave of selling in the technology sector that emerged earlier this week has weighed on European equities. The trigger was investor concern over the profitability of large-scale debt-funded investments by major US tech companies in AI infrastructure. The Nasdaq

Euro Hits Fresh Yearly Lows Amid Dovish ECB Signals
The euro remains under pressure following weak macroeconomic data from the euro area and fresh signals that the European Central Bank is prepared to maintain a more accommodative monetary policy stance. Data released yesterday pointed to a deterioration in business

Pound at Key Levels: Markets Assess Impact of Political Uncertainty in the UK
The British pound remains under pressure following increased political uncertainty in the United Kingdom triggered by the Prime Minister’s resignation. Investors are assessing potential shifts in the political and economic policy outlook after the head of government stepped down,