


Gold and Crude Oil Could Accelerate Declines
FXOpen
Gold price topped near the $1,237 level and declined recently. Crude oil price is under a lot of pressure and it may slide further towards the $60.00 or $58.00 levels.
Important Takeaways for Gold and Oil
- Gold price traded higher nicely until sellers appear near the $1,236-1,237 zone against the US Dollar.
- There was a break below a major bullish trend line with support at $1,226 on the hourly chart of gold.
- Crude oil price declined heavily recently after topping above the $68.00 pivot level.
- There is a key declining channel in place with resistance at $61.70 on the hourly chart of XTI/USD.
Gold Price Technical Analysis
Gold price followed a nice upward move from the $1,212 support area against the US Dollar. The price traded higher and it broke key resistances near the $1,220 and $1,224 levels before sellers appeared near $1,237.
The upside move was positive as the price broke the $1,230 resistance and the 50 hourly simple moving average as well. However, the price faced a lot of selling interest near the $1,236, $1,237 and $1,238 resistance levels.
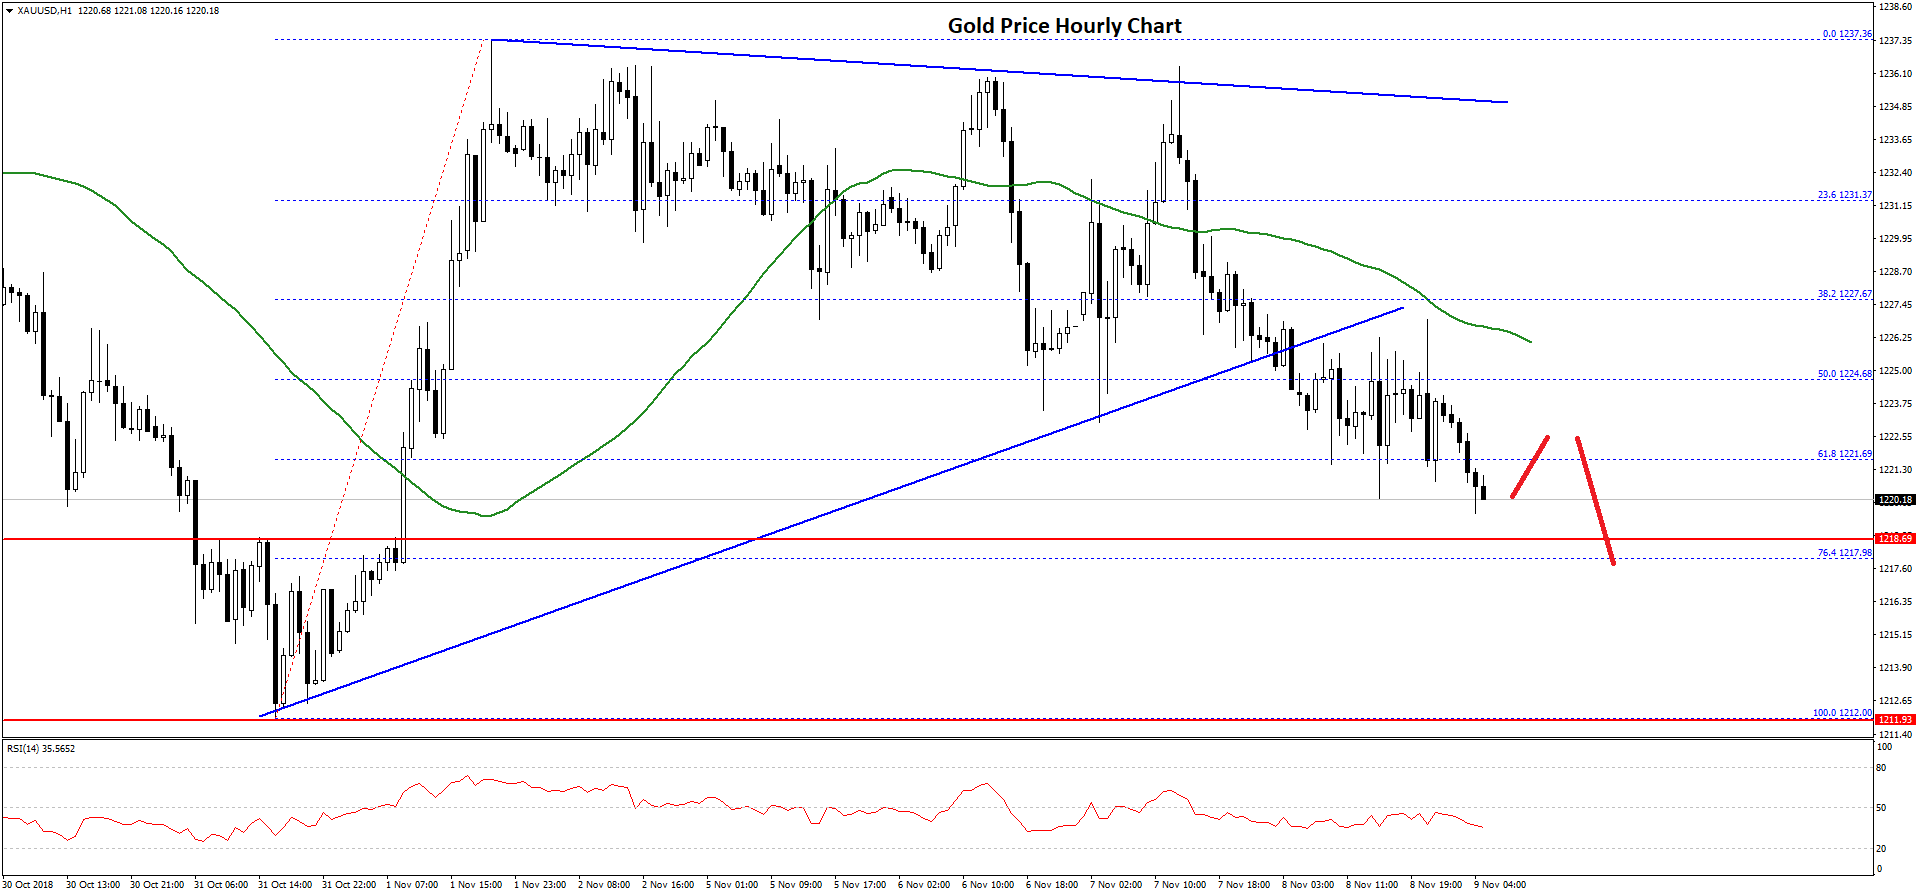
A swing high was formed at $1,237.36 on FXOpen before the price started a downside move. It broke a major bullish trend line with support at $1,226 on the hourly chart. Besides, there was a break below the 61.8% Fib retracement level of the last wave from the $1,212 low to $1,237 high.
It opened the doors for more losses and pushed the price in a bearish zone below the $1,220 support. It seems like the price may continue to move down towards the $1,212 support area in the near term.
On the other hand, if there is an upside correction, the price may face sellers near the $1,221 level. Above $1,220-1,221, the price could retest the $1,225 resistance and the 50 hourly simple moving average where sellers are likely to emerge.
Overall, gold is currently following a bearish path towards the $1,212 support and any recovery is likely to face sellers on the upside.
Oil Price Technical Analysis
Crude oil price failed to hold gains above the $68.00 pivot level and declined heavily against the US Dollar. The price traded lower and broke a few key supports near the $66.00 and $64.00 levels.
The recent decline was such that the price even broke the $62.00 support and the 50 hourly simple moving average. It traded close to the $60.00 support recently and formed a low at $60.42.
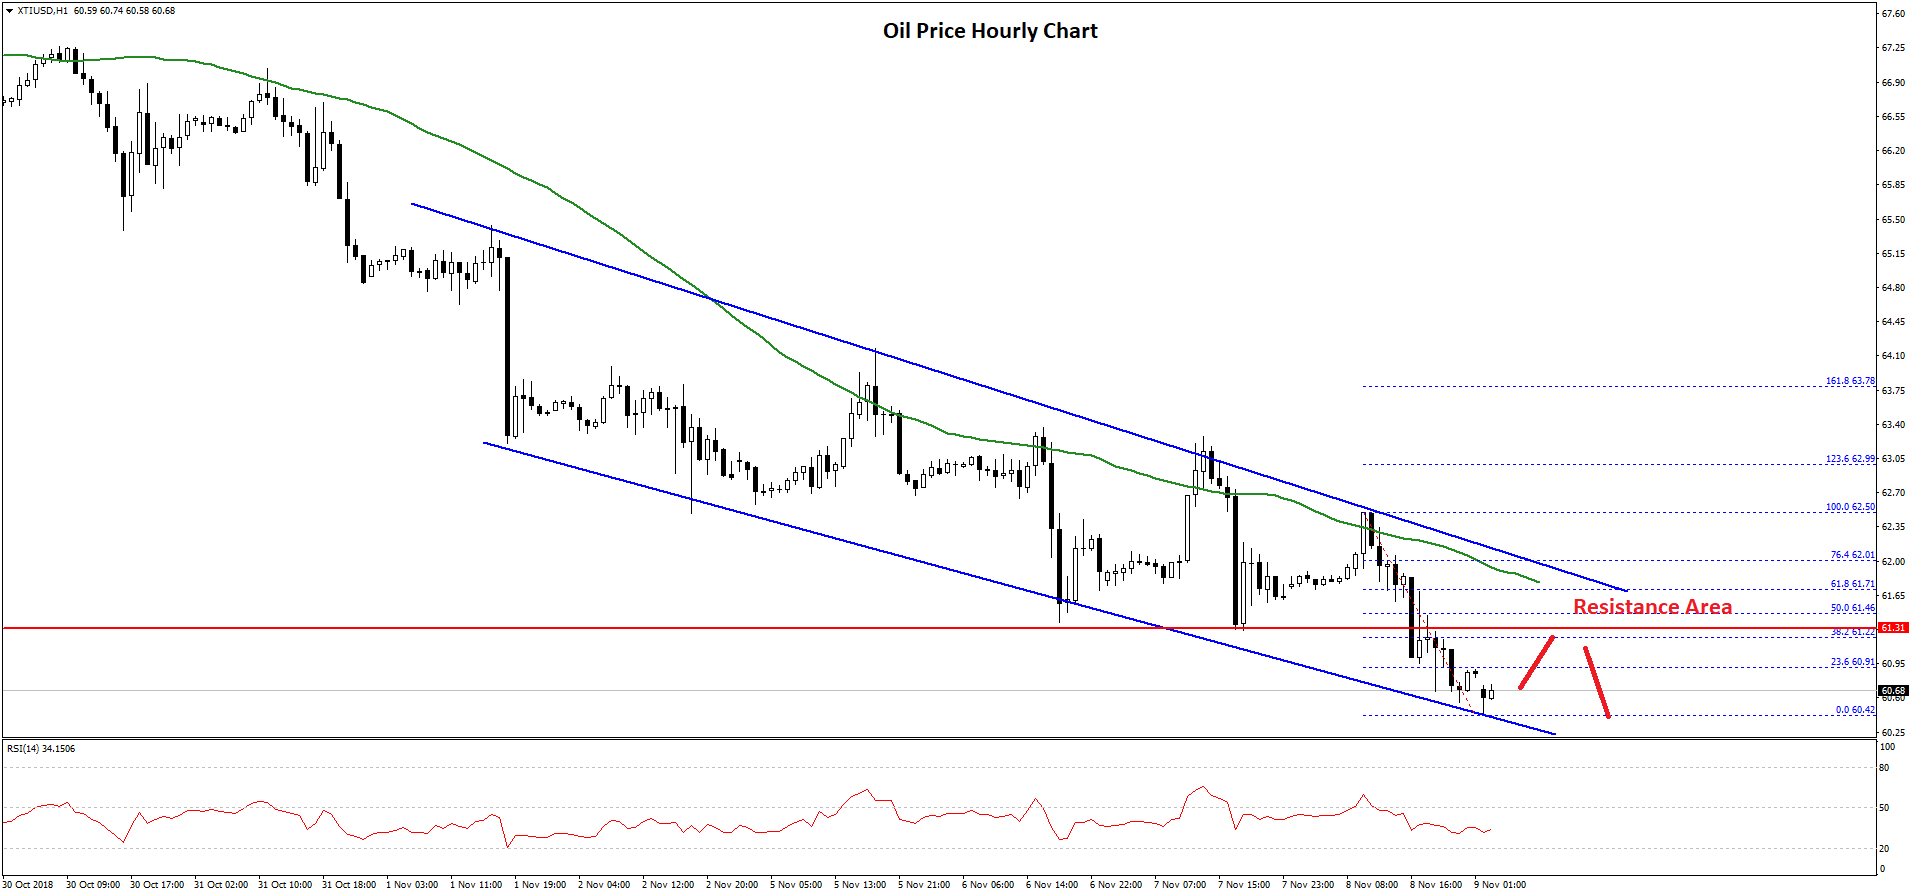
At the moment, the price is consolidating losses and it could test the 23.6% Fib retracement level of the recent decline from the $62.50 high to $60.42 low. More importantly, there is a key declining channel in place with resistance at $61.70 on the hourly chart of XTI/USD.
Around the channel resistance, the 50 hourly SMA is positioned along with the 50% Fib retracement level of the recent decline from the $62.50 high to $60.42 low.
Therefore, if the price corrects higher from the current levels, sellers are likely to appear near the $61.20, $61.50 or $61.80 resistance levels.
On the downside, a downside break below the recent low at $60.40 will most likely increase chances of a push below the $60.00 support. The next major support in the mentioned case could be near the $59.40 level.
Trade over 50 forex markets 24 hours a day with FXOpen. Take advantage of low commissions, deep liquidity, and spreads from 0.0 pips (additional fees may apply). Open your FXOpen account now or learn more about trading forex with FXOpen.
This article represents the opinion of the Companies operating under the FXOpen brand only. It is not to be construed as an offer, solicitation, or recommendation with respect to products and services provided by the Companies operating under the FXOpen brand, nor is it to be considered financial advice.
Stay ahead of the market!
Subscribe now to our mailing list and receive the latest market news and insights delivered directly to your inbox.


Latest articles

EUR/USD Eyes Gains As USD/CHF Weakness Deepens Again
EUR/USD started a fresh increase above 1.1700 and 1.1720. USD/CHF declined further and is now struggling below 0.7835.
Important Takeaways for EUR/USD and USD/CHF Analysis Today
· The Euro started a decent increase from

Apple: Earnings Day Above the Activity Zone
On 30 April, after the market close, Apple Inc. will release its financial results for the second quarter of fiscal 2026. The consensus forecast, based on estimates from 31 analysts, points to revenue of around $109.7 billion, with expected

USD/JPY and USD/CHF Near Key Levels: The Dollar Supported by the Fed
The US dollar continues to trend upwards following the Federal Reserve meeting, drawing support from the regulator’s moderately hawkish stance and comments by Jerome Powell. Markets interpret the Fed’s rhetoric as a signal that restrictive policy is likely