


FXOpen
Gold price declined recently and traded below the $1,300 support area. Crude oil price seems to be forming a short term top below $63.00 and it could decline below $62.00
Important Takeaways for Gold and Oil
- Gold price started a major drop and traded below the $1,300 support level against the US Dollar.
- There is a key connecting bearish trend line in place with resistance near $1,292 on the hourly chart of gold.
- Crude oil price broke a significant ascending channel with support at $62.60 on the hourly chart of XTI/USD.
- The price is currently at a risk of more losses below the $62.00 and $61.60 support levels.
Gold Price Technical Analysis
Gold price started a major downside move after it failed to stay above the $1,315 support level against the US Dollar. The price declined below the $1,308 and $1,305 support levels to move into a bearish zone.
Finally, the price broke the $1,300 support and settled below the 50 hourly simple moving average. The decline gained pace below $1,295 and the price even broke the $1,290 support. A new swing low was formed at $1,281 on FXOpen and the price recently recovered higher.
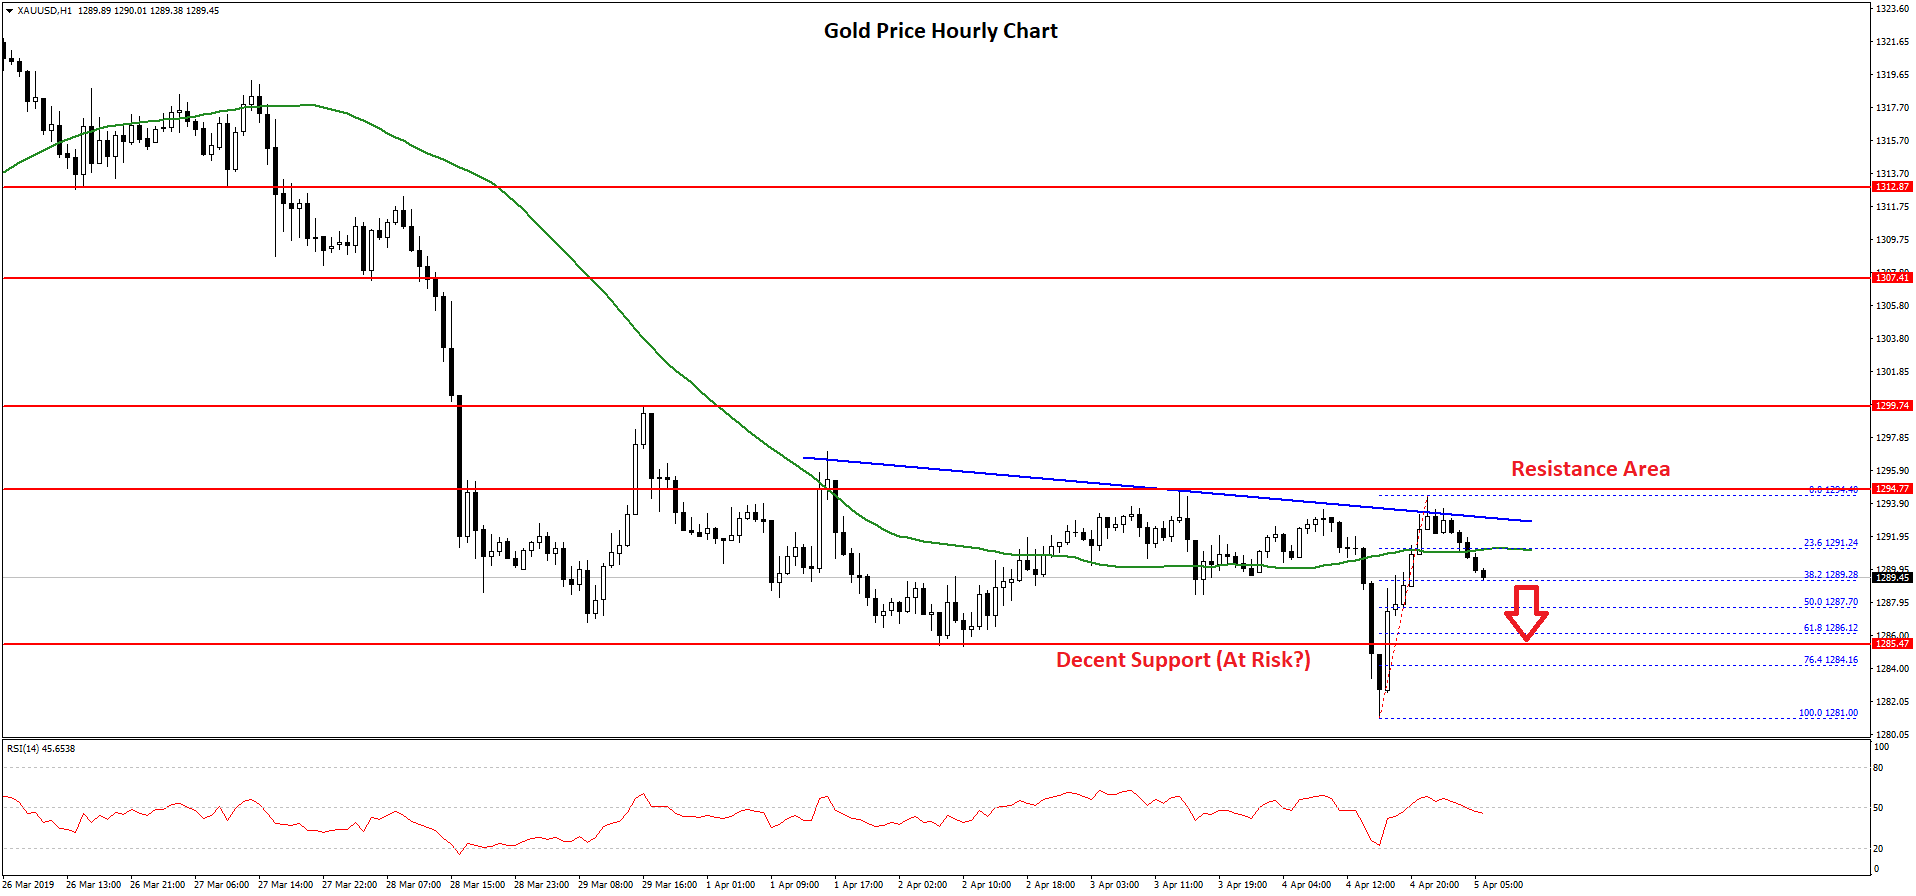
It moved above the $1,290 level, but sellers defended the $1,294 resistance area. There is also a key connecting bearish trend line in place with resistance near $1,292 on the hourly chart of gold.
The price is moving lower again and is currently trading below the $1,290 level and the 50 hourly simple moving average. It is likely to test the 50% Fib retracement level of the recent wave from the $1,281 low to $1,294 high.
However, the main support is near the $1,285 level and the 61.8% Fib retracement level of the recent wave from the $1,281 low to $1,294 high. If there is a break below the $1,285 support area, the price is likely to test the $1,280 level.
Should sellers remain in control, the price may even test the $1,272 level. On the upside, the price must settle above the trend line resistance and the $1,295 level to start a decent rebound in the near term.
Oil Price Technical Analysis
Crude oil price started a nasty upward move from the $58.30 swing low against the US Dollar. The price rallied steadily and broke the $60.00 and $62.00 resistance levels.
The price even broke the $62.50 level, but it struggled to gain momentum above the $63.00 resistance level. Later, it started a downside move and broke the key $62.50 support. Besides, there was a break below a significant ascending channel with support at $62.60 on the hourly chart of XTI/USD.
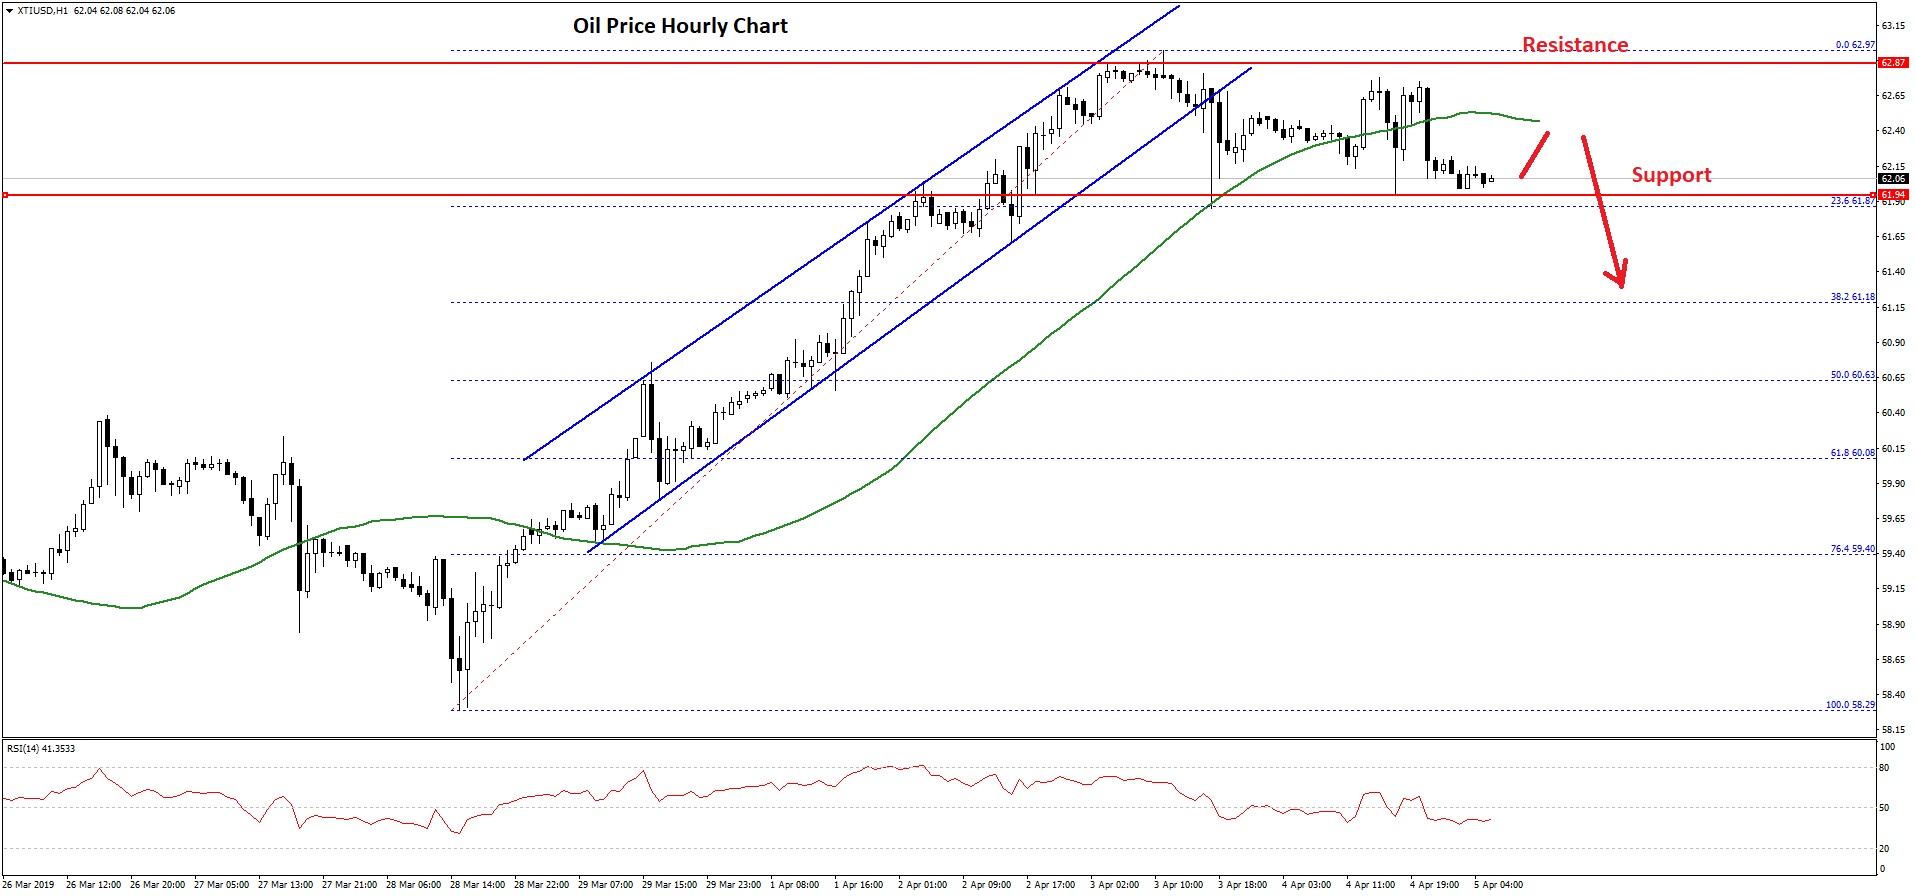
The price traded below the $62.40 level and the 50 hourly simple moving average. It tested the 23.6% Fib retracement level of the recent wave from the $58.29 low to $62.97 high.
If there is a downside break below the $62.00 support area, the price may move into a short term bearish zone. The next support is near the $61.50 level. If there are more losses, the price may even test the $60.60 support.
The 50% Fib retracement level of the recent wave from the $58.29 low to $62.97 high is also near the $60.60 level. On the other hand, if buyers protect the $62.00 support, the price could bounce back above $62.50 and it may even break the $63.00 resistance.
Trade over 50 forex markets 24 hours a day with FXOpen. Take advantage of low commissions, deep liquidity, and spreads from 0.0 pips (additional fees may apply). Open your FXOpen account now or learn more about trading forex with FXOpen.
This article represents the opinion of the Companies operating under the FXOpen brand only. It is not to be construed as an offer, solicitation, or recommendation with respect to products and services provided by the Companies operating under the FXOpen brand, nor is it to be considered financial advice.
Stay ahead of the market!
Subscribe now to our mailing list and receive the latest market news and insights delivered directly to your inbox.


Latest articles

The US Dollar Index (DXY) Climbs to a One-and-a-Half-Month High
Today, the US Dollar Index rose above the 98.70 level for the first time since the third week of January. Monday’s trading opened with a bullish gap, and upward momentum continues to build as news emerges of a

Iran Conflict and Economic Data: Events in Focus for 2-6 March
Let’s discuss three upcoming events that may impact market activity across currencies, equities, and commodities.
✔️Washington and Israel struck Iran, the supreme leader of Iran Ayatollah Khamenei was killed. Iran retaliated, escalating tensions.
Oil jumped over 8%, global stocks

WTI Oil Trading Opens with a 10% Bullish Gap
On Friday, we warned that trading on Monday could be volatile — but not to this extent! The situation sharply escalated over the weekend following a large-scale strike by Israel and the US on targets in Iran, during which the supreme