


FXOpen
Gold price climbed towards the $1,320 level recently before correcting lower. Crude oil price is currently consolidating gains and remains supported on dips near $59.50.
Important Takeaways for Gold and Oil
- Gold price is placed nicely in an uptrend above the $1,300 support level against the US Dollar.
- There is a major bullish trend line in place with support at $1,305 on the hourly chart of gold.
- Crude oil price spiked above the $60.00 level before it ran into a connecting resistance trend line at $60.40 on the hourly chart of XTI/USD.
- The price is correcting lower, but it remains supported near the $59.50 and $59.20 support levels.
Gold Price Technical Analysis
Gold price started a solid upward move from well below the $1,295 level against the US Dollar. The price climbed above the $1,300 and $1,305 resistance levels to move into a positive zone.
The price even broke the $1,310 resistance and the 50 hourly simple moving average. It traded as high as $1,320 on FXOpen before sellers initiated a fresh downside correction. They pushed the price below the $1,310 support and the 50 hourly SMA.
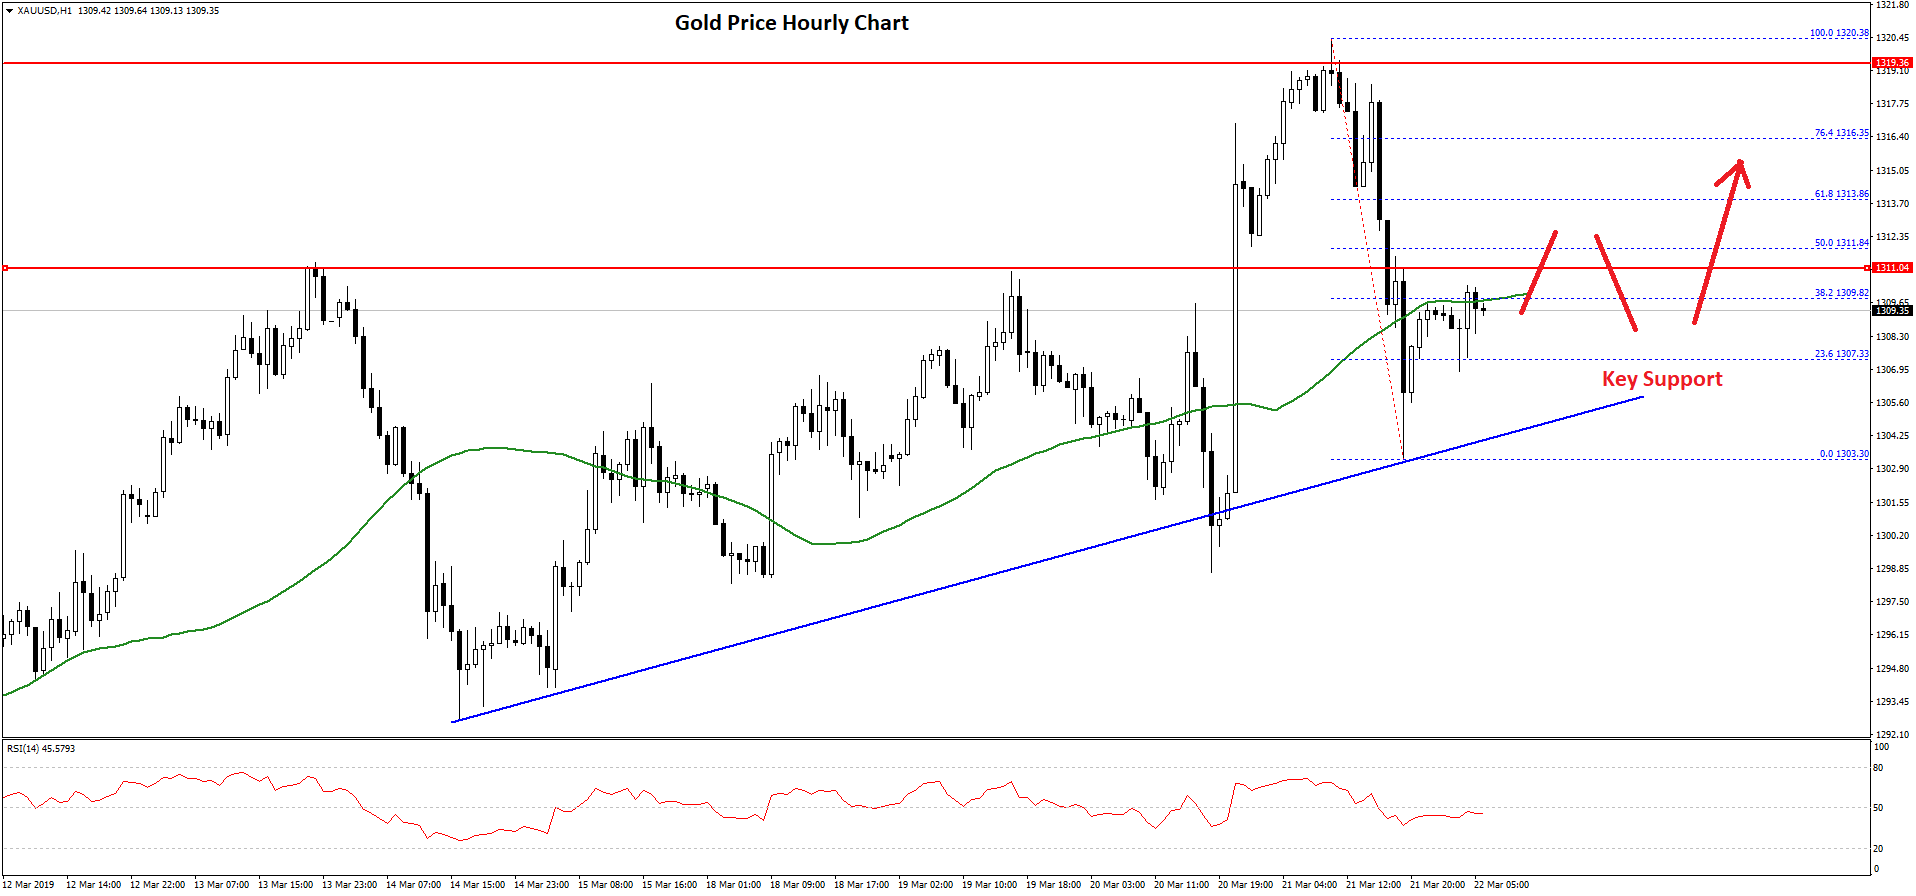
However, the price remained supported above the $1,300 level. A low was formed near $1,303 and recently the price corrected higher. It is currently testing the $1,310 resistance and the 50 hourly SMA.
Besides, the 38.2% Fib retracement level of the recent decline from the $1,320 high to $1,303 low is also near the $1,309 level. The next key resistance is near the $1,312 level, which acted as a hurdle for buyers on many occasions earlier.
The 50% Fib retracement level of the recent decline from the $1,320 high to $1,303 low is also near the $1,312 level. Therefore, a successful break above the $1,310 and $1,312 levels is must for the price to extend the current upward move.
If it declines once again, an initial support is near the $1,307 level. There is also a major bullish trend line in place with support at $1,305 on the hourly chart of gold.
Oil Price Technical Analysis
Crude oil price followed a slow and steady rise from the $57.50 support zone against the US Dollar. The price traded higher and broke the $58.00 and $58.80 resistance levels.
The price even settled above the $59.50 level and the 50 hourly simple moving average. Finally, there was a break above the $60.00 resistance area. However, the price faced a strong barrier near a connecting resistance trend line at $60.40 on the hourly chart of XTI/USD.
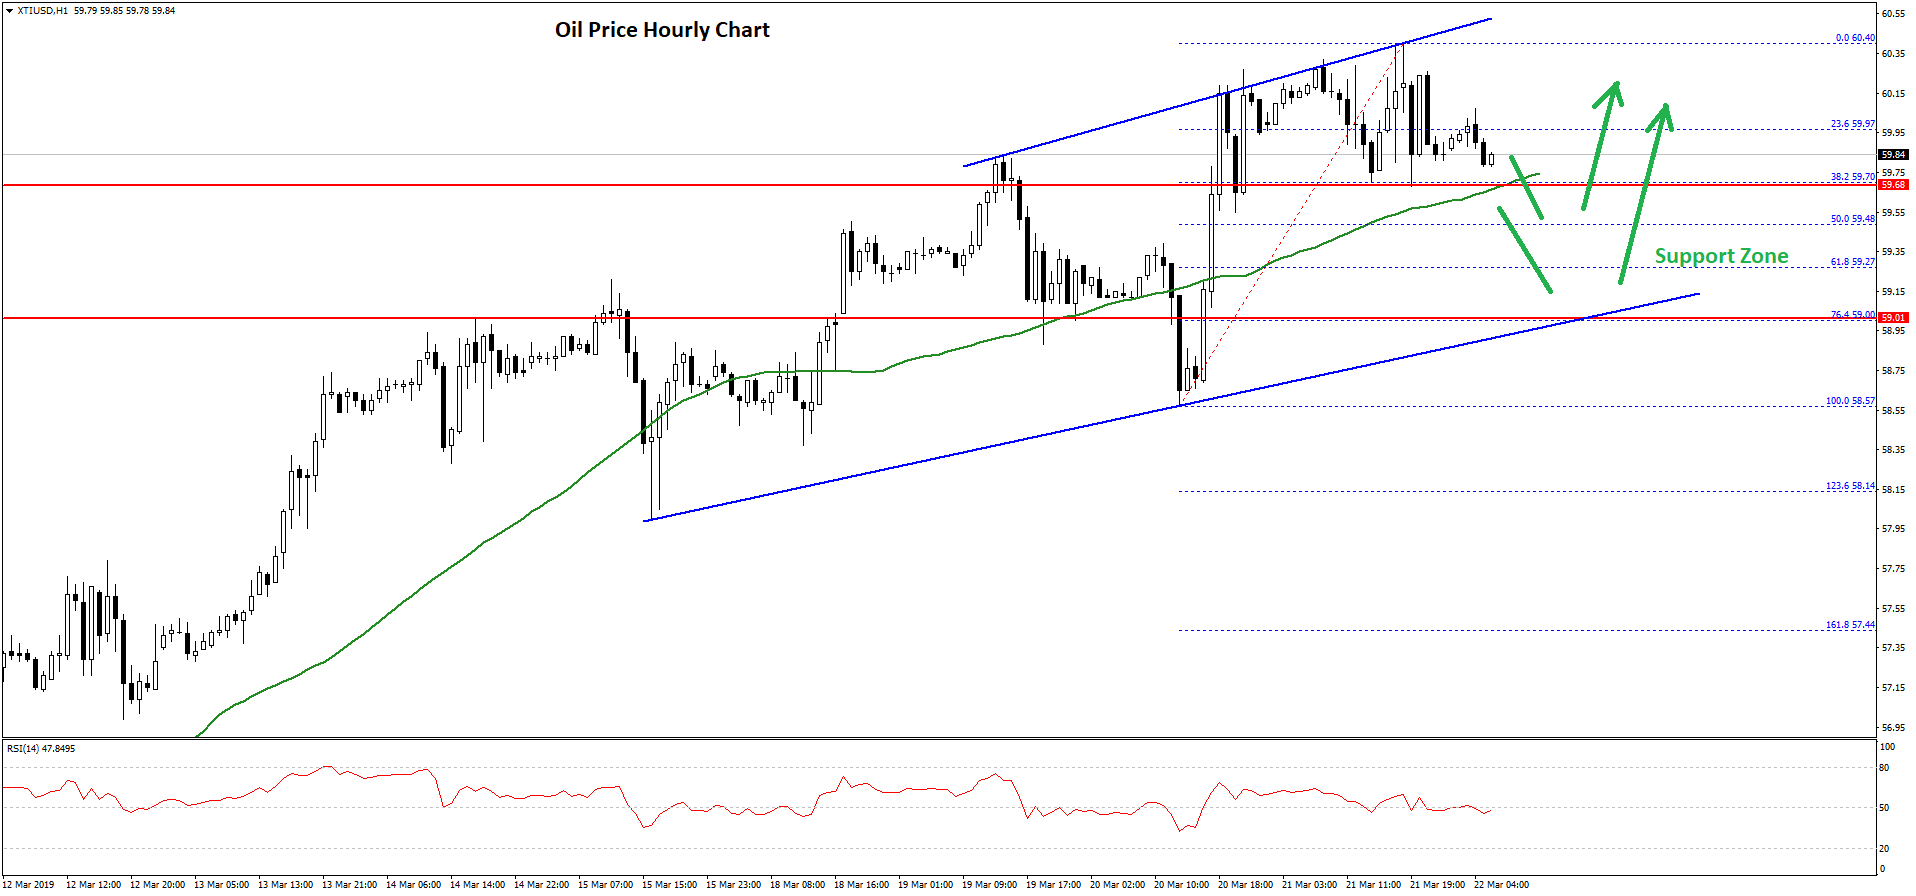
The price started a downside correction and traded below the $60.00 level. There was a break below the 23.6% Fib retracement level of the recent wave from the $58.57 low to $60.40 high.
However, there is a strong support formed near the $59.70 level and the 50 hourly SMA. The next key support is near $59.50 and the 50% Fib retracement level of the recent wave from the $58.57 low to $60.40 high.
If the price continues to move down, it is likely to find a strong support near the $59.20 level. On the upside, an initial resistance is at $60.20, above which the price is likely to clear the $60.40 high and trade further higher.
Trade over 50 forex markets 24 hours a day with FXOpen. Take advantage of low commissions, deep liquidity, and spreads from 0.0 pips. Open your FXOpen account now or learn more about trading forex with FXOpen.
This article represents the opinion of the Companies operating under the FXOpen brand only. It is not to be construed as an offer, solicitation, or recommendation with respect to products and services provided by the Companies operating under the FXOpen brand, nor is it to be considered financial advice.
Stay ahead of the market!
Subscribe now to our mailing list and receive the latest market news and insights delivered directly to your inbox.

Latest from Forex Analysis
Latest articles

Weekly Market Wrap With Gary Thomson: Nasdaq, EUR/USD, USD/CHF, Brent Crude Oil, Googl Shares
Get the latest scoop on the week's hottest headlines, all in one convenient video. Join Gary Thomson, the COO of FXOpen UK, as he breaks down the most significant news reports and shares his expert insights.
- Nasdaq Composite: Worst Session

Analysis of AUD/USD: Exchange Rate Falls to Early May Low
As indicated by the 4-hour AUD/USD chart today:
→ the rate fell below 0.652, a level last seen on May 2;
→ the RSI indicator dropped below 15, a level last seen during the panic over the spread of COVID-19

Analysis of AMZN Stock: Price at 1.5-Month Low
As shown in the AMZN chart, the stock price dropped below:
→ the psychological level of $180;
→ the mid-June interim low.
The last time AMZN traded below $180 was in early June.
Thus, AMZN has faced sell-offs, similar to other tech