


FXOpen

Gold price declined recently and broke the key $1,485 support area. Crude oil price is also under pressure and it seems like it could decline below the $56.50 support.
Important Takeaways for Gold and Oil
- Gold price declined heavily after it failed to climb above the $1,515 resistance area against the US Dollar.
- There is a major bearish trend line forming with resistance near $1,480 on the hourly chart of gold.
- Crude oil price is struggling to clear $58.00 and it is currently declining below $57.00.
- There is a key bullish trend line forming with support near $56.80 on the hourly chart of XTI/USD.
Gold Price Technical Analysis
Recently, gold price made a few attempts to surpass the $1,515 resistance area against the US Dollar. It failed to continue higher and started a fresh decline below the $1,505 and $1,500 support levels.
During the decline, the price broke a couple of important supports near the $1485 level and the 50 hourly simple moving average. Finally, the price broke the $1,475 support area and traded as low as $1,460 on FXOpen.
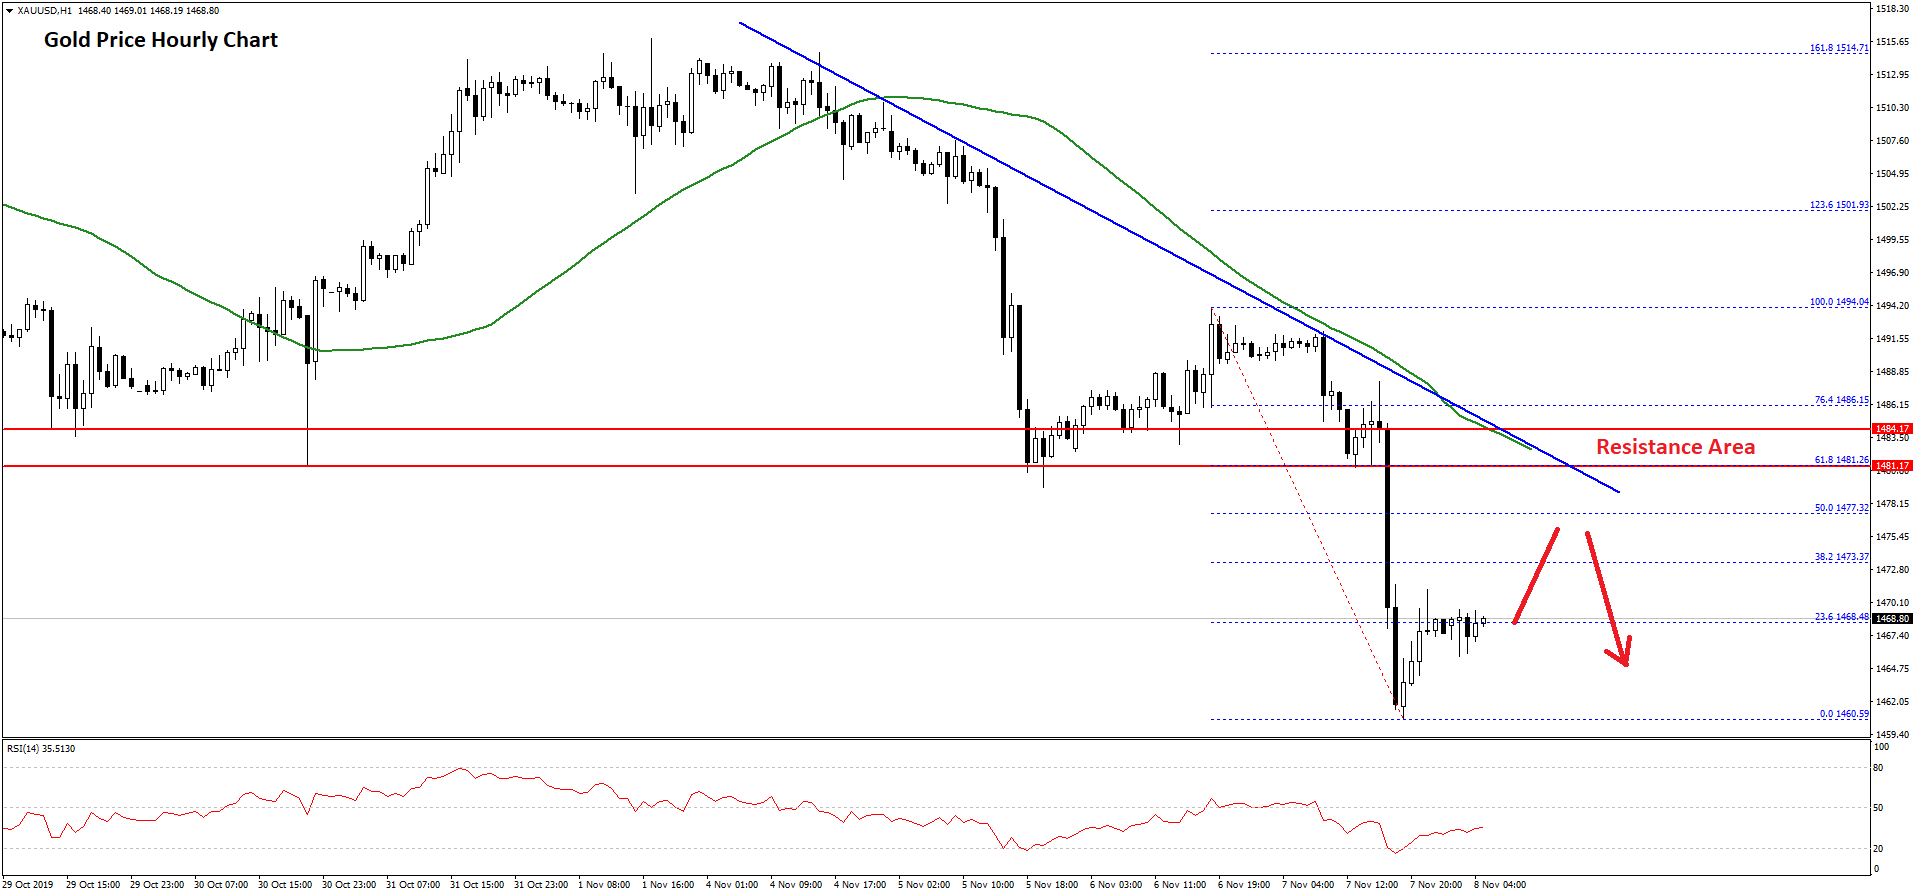
At the moment, the price is correcting higher above $1,465. It is trading near the 23.6% Fib retracement level of the recent decline from the $1,494 high to $1,460 low.
However, there are many hurdles on the upside near the $1,475 and $1,480 levels. Besides, the 50% Fib retracement level of the recent decline from the $1,494 high to $1,460 low is near the $1,477 level to act as a resistance.
There is also a major bearish trend line forming with resistance near $1,480 on the hourly chart of gold. The main resistance is near the $1,485 level, above which the price could start a nice upward move.
On the downside, an initial support is near the $1,460 level. If gold price fails to stay above the $1,460 support, there is a risk of more downsides towards the $1,450 support area.
Oil Price Technical Analysis
This week, there was a steady rise in crude oil price above the $55.00 resistance area against the US Dollar. The price even broke the $56.20 resistance zone to move into a positive zone.
Finally, the price settled above $56.50 and the 50 hourly simple moving average. However, the bulls faced a strong resistance near the $57.80 and $58.00 levels. A high was formed near $57.81 and the price started a downside correction.
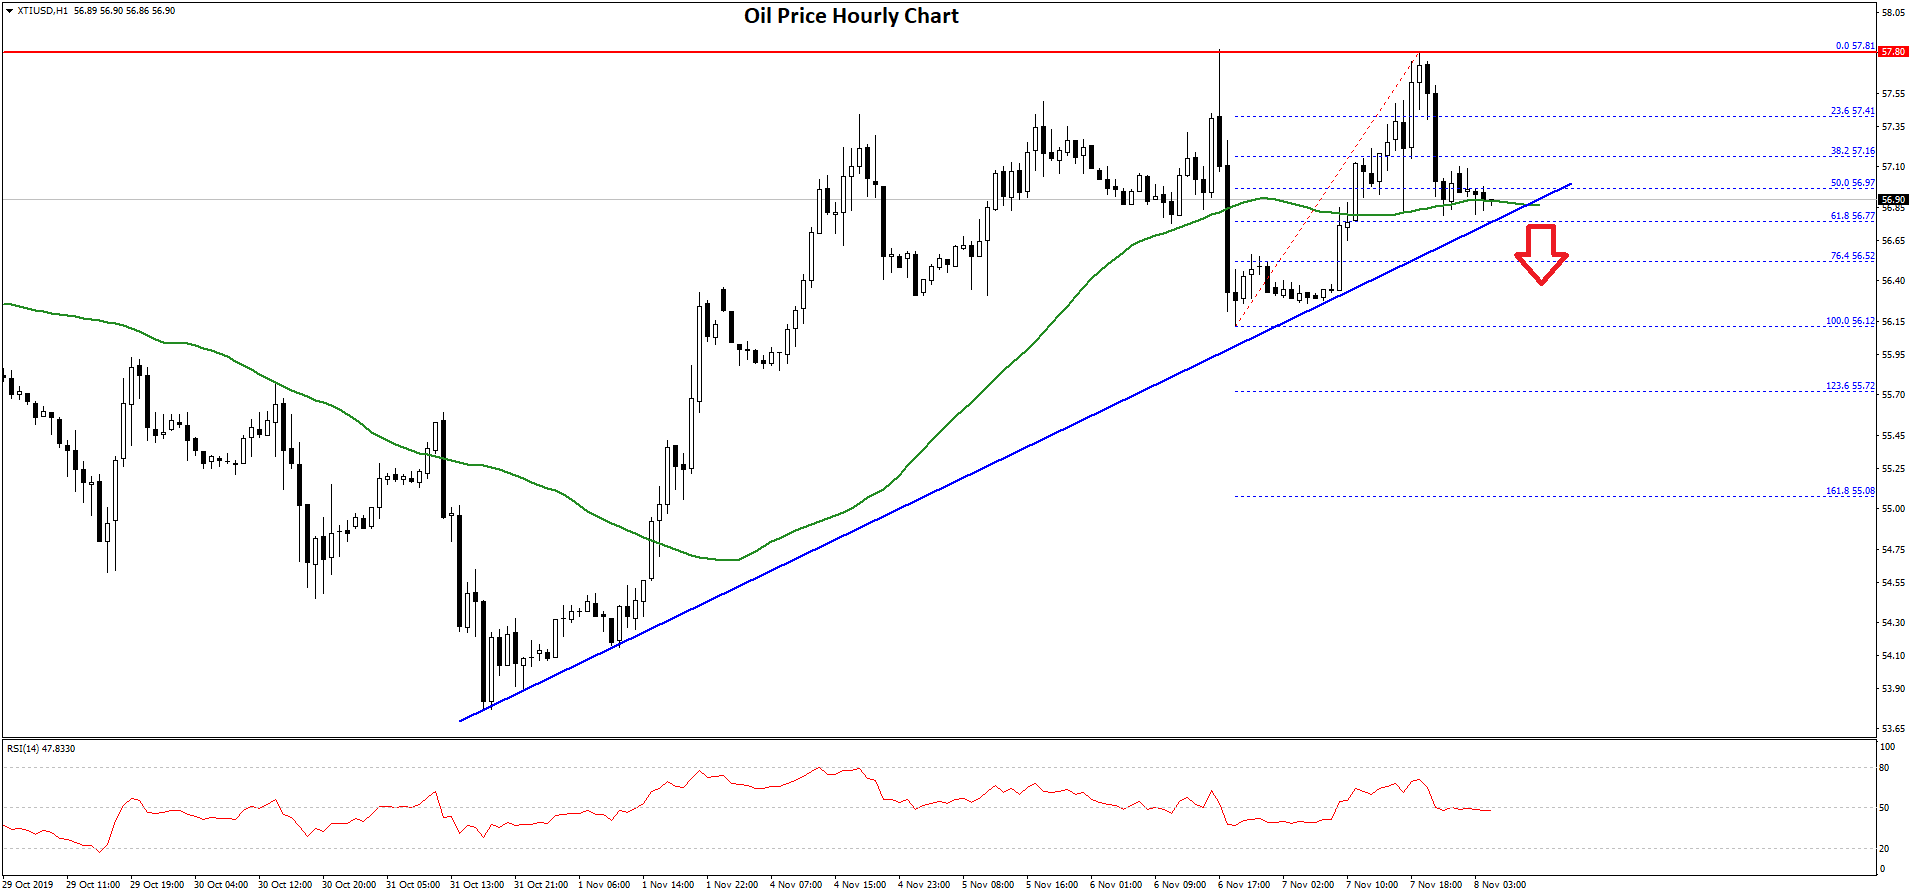
There was a break below the $57.50 support area. Moreover, the price traded below the 23.6% Fib retracement level of the recent wave from the $56.12 low to $57.81 high.
At the moment, the price is trading near the $57.00 support area and the 50 hourly SMA. Besides, there is a key bullish trend line forming with support near $56.80 on the hourly chart of XTI/USD.
The 61.8% Fib retracement level of the recent wave from the $56.12 low to $57.81 high is also near the $56.75 area. Therefore, if there is a downside break below the $57.00 and $56.80 support, there is a risk of more downsides in the coming days.
On the upside, the $57.50 level is an immediate resistance. However, the main resistance for crude oil price is near the $57.80 and $58.00 levels, above which the price could rally to $60.00.
Trade over 50 forex markets 24 hours a day with FXOpen. Take advantage of low commissions, deep liquidity, and spreads from 0.0 pips. Open your FXOpen account now or learn more about trading forex with FXOpen.
This article represents the opinion of the Companies operating under the FXOpen brand only. It is not to be construed as an offer, solicitation, or recommendation with respect to products and services provided by the Companies operating under the FXOpen brand, nor is it to be considered financial advice.
Stay ahead of the market!
Subscribe now to our mailing list and receive the latest market news and insights delivered directly to your inbox.

Latest from Forex Analysis
Latest articles

Weekly Market Wrap With Gary Thomson: Nasdaq, EUR/USD, USD/CHF, Brent Crude Oil, Googl Shares
Get the latest scoop on the week's hottest headlines, all in one convenient video. Join Gary Thomson, the COO of FXOpen UK, as he breaks down the most significant news reports and shares his expert insights.
- Nasdaq Composite: Worst Session

Analysis of AUD/USD: Exchange Rate Falls to Early May Low
As indicated by the 4-hour AUD/USD chart today:
→ the rate fell below 0.652, a level last seen on May 2;
→ the RSI indicator dropped below 15, a level last seen during the panic over the spread of COVID-19

Analysis of AMZN Stock: Price at 1.5-Month Low
As shown in the AMZN chart, the stock price dropped below:
→ the psychological level of $180;
→ the mid-June interim low.
The last time AMZN traded below $180 was in early June.
Thus, AMZN has faced sell-offs, similar to other tech