


Gold Plunges As US Jobless Claims Drop to Lowest Level Since 1973
FXOpen
Gold fell sharply yesterday during the US session after a labor department’s report showed that the Jobless claims unexpectedly decreased to the lowest level since 1973, indicating the U.S. labor market remains a pillar of support in the world’s largest economy. The technical bias however remains bullish because of a Higher High in the recent upside rally.
Technical Analysis
As of this writing, the yellow metal is being traded near 1246. An immediate support is being noticed around 1243.00 ahead of 1237.00, both are key horizontal levels ahead of 1223.00, the swing low of the last major downside move on the four-hour timeframe.
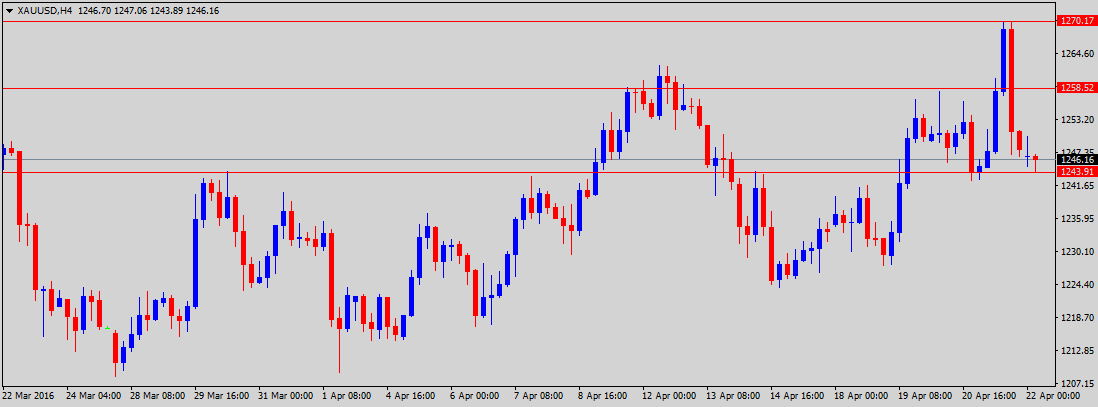
On the upside, the precious metal is likely to face a hurdle near 1258.00 ahead of $1270, the swing high of last major upside rally as well as a key horizontal resistance as demonstrated in the above chart. The technical bias will remain bullish as long as the 1223.00 support area is intact.
US Jobless Claims
New applications for unemployment benefits fell by 6,000 to 247,000 in the week ended April 16, data from the Labor Department showed Thursday. The median forecast of economists surveyed by Bloomberg called for 265,000 claims. The number of Americans already on benefit rolls declined to a more than 15-year low. Limited dismissals signal that employers are still optimistic about the U.S. demand outlook. The drop in claims occurred in the same week the Labor Department surveys for the monthly employment report, and economists are banking on further job growth to support consumer spending and help prop up economic growth after a weak first quarter.
Trade Idea
Considering the overall technical and fundamental outlook, selling the precious metal on rally towards $1258.00 could be a good strategy in short term.
Trade over 50 forex markets 24 hours a day with FXOpen. Take advantage of low commissions, deep liquidity, and spreads from 0.0 pips (additional fees may apply). Open your FXOpen account now or learn more about trading forex with FXOpen.
This article represents the opinion of the Companies operating under the FXOpen brand only. It is not to be construed as an offer, solicitation, or recommendation with respect to products and services provided by the Companies operating under the FXOpen brand, nor is it to be considered financial advice.
Stay ahead of the market!
Subscribe now to our mailing list and receive the latest market news and insights delivered directly to your inbox.


Latest articles

EUR/USD Eyes Gains As USD/CHF Weakness Deepens Again
EUR/USD started a fresh increase above 1.1700 and 1.1720. USD/CHF declined further and is now struggling below 0.7835.
Important Takeaways for EUR/USD and USD/CHF Analysis Today
· The Euro started a decent increase from

Apple: Earnings Day Above the Activity Zone
On 30 April, after the market close, Apple Inc. will release its financial results for the second quarter of fiscal 2026. The consensus forecast, based on estimates from 31 analysts, points to revenue of around $109.7 billion, with expected

USD/JPY and USD/CHF Near Key Levels: The Dollar Supported by the Fed
The US dollar continues to trend upwards following the Federal Reserve meeting, drawing support from the regulator’s moderately hawkish stance and comments by Jerome Powell. Markets interpret the Fed’s rhetoric as a signal that restrictive policy is likely