


Gold Poised For Bullish Breakout As Key Trendline Looks Vulnerable
FXOpen
The price of gold extended downside movement on Friday, dragging the price of yellow metal to less than $1160 an ounce in a range-bound Asian trading session. The technical bias remains slightly bullish due to a Higher Low on hourly timeframe in the last downside dip. The price is however holding off downward trendline nicely which may increase selling pressure in near future.
Technical Analysis
As of this writing, the price of gold is being traded near $1159 an ounce. A hurdle can be seen around $1161, the trendline resistance ahead of $1166, the swing high of the last hourly wave as demonstrated in the following chart. A break and daily closing above the trendline resistance could incite renewed buying interest, validating a move towards the 1167 and 1180.
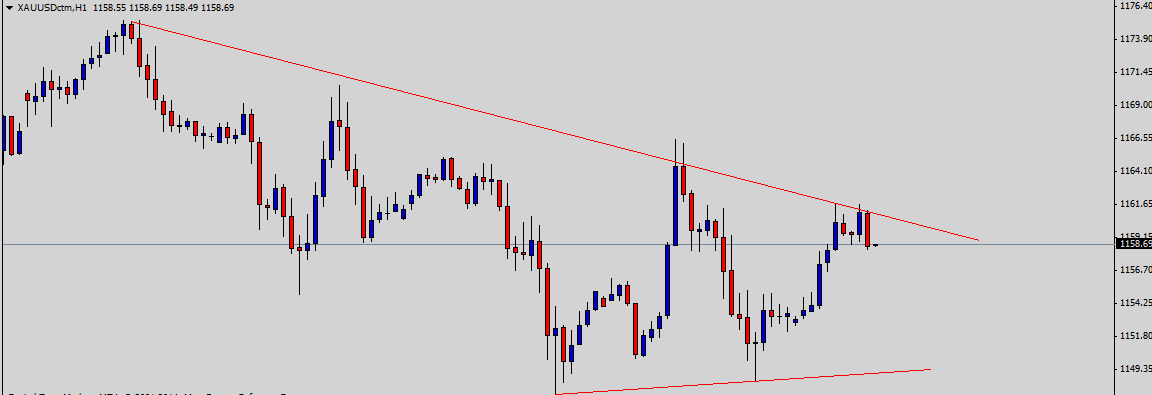
On the downside, the price of bullion is likely to find a support around $1158, the low of the last hourly candle ahead of $1150, the confluence of psychological number as well as trendline support. The technical bias will remain slightly bullish as long as the $1152 hurdle remains intact.
US Producer Price Index
The US Producer Price Index news is due today in the New York opening session. According to the average forecast of different economists, the producer price index remained 0% in February as compared to the same reading in the same month of the year before. Generally speaking, higher producer price index reading is considered positive for the economy thus a better than expected actual outcome may spur bearish momentum in the price of gold.
Trade Idea
Considering the overall technical and fundamental outlook, buying the yellow metal on an hourly close above the trendline resistance area could be a good strategy in short to medium term.
Trade over 50 forex markets 24 hours a day with FXOpen. Take advantage of low commissions, deep liquidity, and spreads from 0.0 pips (additional fees may apply). Open your FXOpen account now or learn more about trading forex with FXOpen.
This article represents the opinion of the Companies operating under the FXOpen brand only. It is not to be construed as an offer, solicitation, or recommendation with respect to products and services provided by the Companies operating under the FXOpen brand, nor is it to be considered financial advice.
Stay ahead of the market!
Subscribe now to our mailing list and receive the latest market news and insights delivered directly to your inbox.


Latest articles

DAX 40: consolidation amid technology sell-off
A wave of selling in the technology sector that emerged earlier this week has weighed on European equities. The trigger was investor concern over the profitability of large-scale debt-funded investments by major US tech companies in AI infrastructure. The Nasdaq

Euro Hits Fresh Yearly Lows Amid Dovish ECB Signals
The euro remains under pressure following weak macroeconomic data from the euro area and fresh signals that the European Central Bank is prepared to maintain a more accommodative monetary policy stance. Data released yesterday pointed to a deterioration in business

Pound at Key Levels: Markets Assess Impact of Political Uncertainty in the UK
The British pound remains under pressure following increased political uncertainty in the United Kingdom triggered by the Prime Minister’s resignation. Investors are assessing potential shifts in the political and economic policy outlook after the head of government stepped down,