


Gold Price and Crude Oil Price Aim Fresh Increase
FXOpen

Gold price is attempting a fresh increase above the $1,780 resistance zone. Crude oil price could gain pace if there is a clear move above the $68.00 level.
Important Takeaways for Gold and Oil
· Gold price started a fresh decline from well above the $1,800 zone against the US Dollar.
· There is a key bearish trend line forming with resistance near $1,775 on the hourly chart of gold.
· Crude oil price declined sharply below $72.00 and $70.00 levels.
· There was a break above a major declining channel with resistance near $66.50 on the hourly chart of XTI/USD.
Gold Price Technical Analysis
Gold price started a fresh decline from well above the $1,820 pivot level against the US Dollar. The price declined heavily and it even broke the $1,800 support zone.
The price even settled below the $1,800 level and the 50 hourly simple moving average. Finally, there was a break below the $1,780 support zone. A low was formed near $1,761 on FXOpen and the price is now correcting higher.
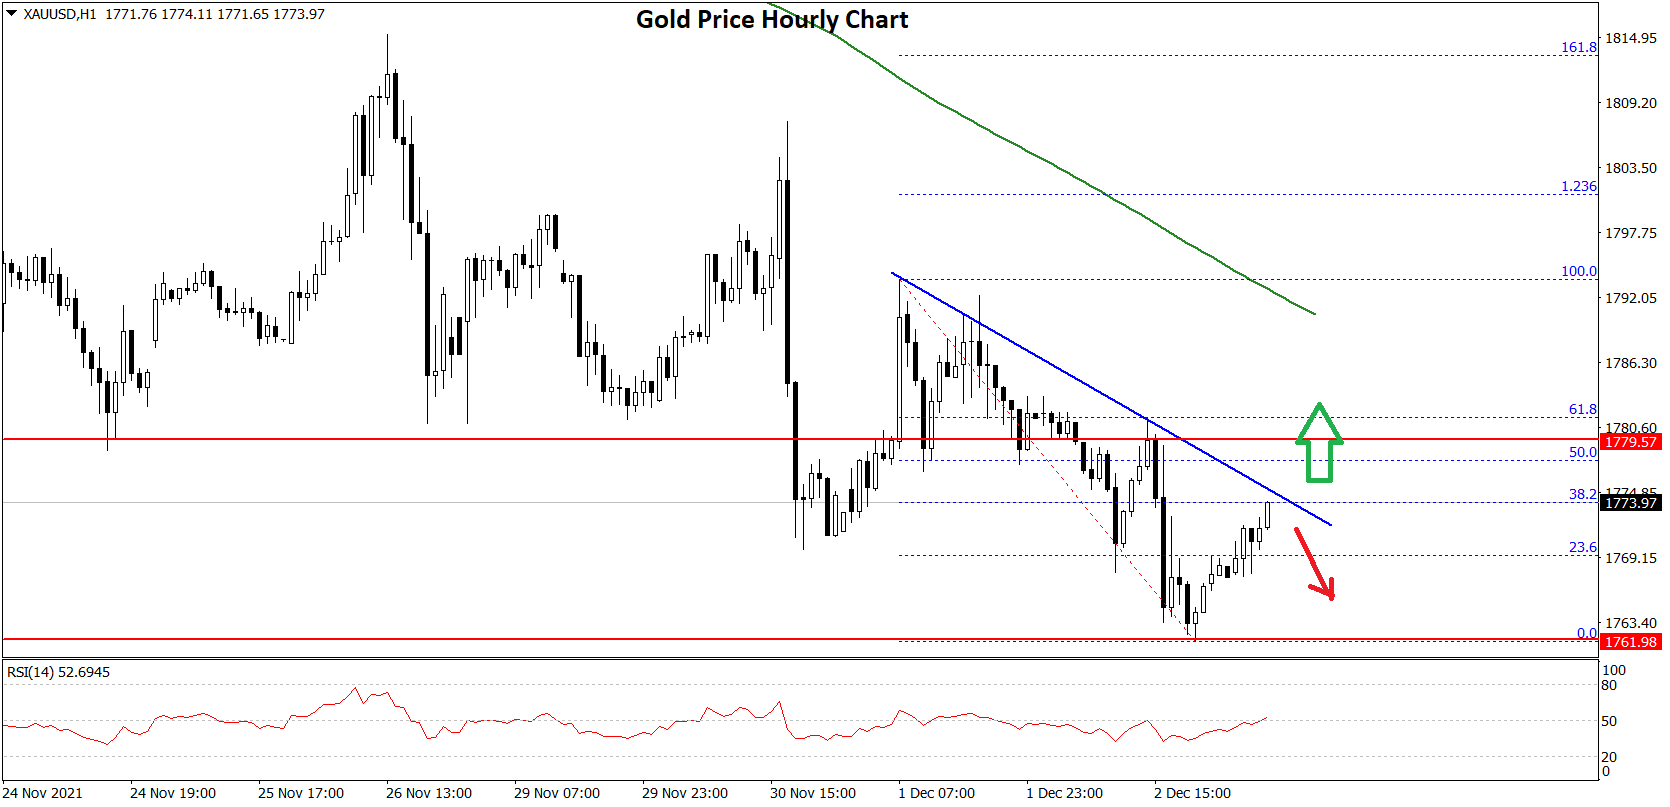
There was a recovery wave above the $1,770 level. The price surpassed the 23.6% Fib retracement level of the recent decline from the $1,795 swing high to $1,761 high.
An immediate resistance on the upside is near the $1,775 level. There is also a key bearish trend line forming with resistance near $1,775 on the hourly chart of gold. The next major resistance is near the $1,780 level.
The 50% Fib retracement level of the recent decline from the $1,795 swing high to $1,761 high is also near $1,780. The main resistance is near the $1,800 level. A close above the $1,800 level could open the doors for a steady increase towards $1,820.
The next major resistance sits near the $1,840 level. On the downside, an initial support is near the $1,765 level. The first major support is near the $1,760 level. A downside break below the $1,760 support zone may possibly spark a steady decline. In the stated case, the price could test the $1,720 support.
Oil Price Technical Analysis
Crude oil price started a major decline after it failed to clear the $80.00 resistance against the US Dollar. The price broke the $75.00 support zone to move into a bearish zone.
The price even cleared the $72.00 level and settled below the 50 hourly simple moving average. The declined extended below the $70.00 level. A low was formed near $62.60 and the price is now correcting higher.
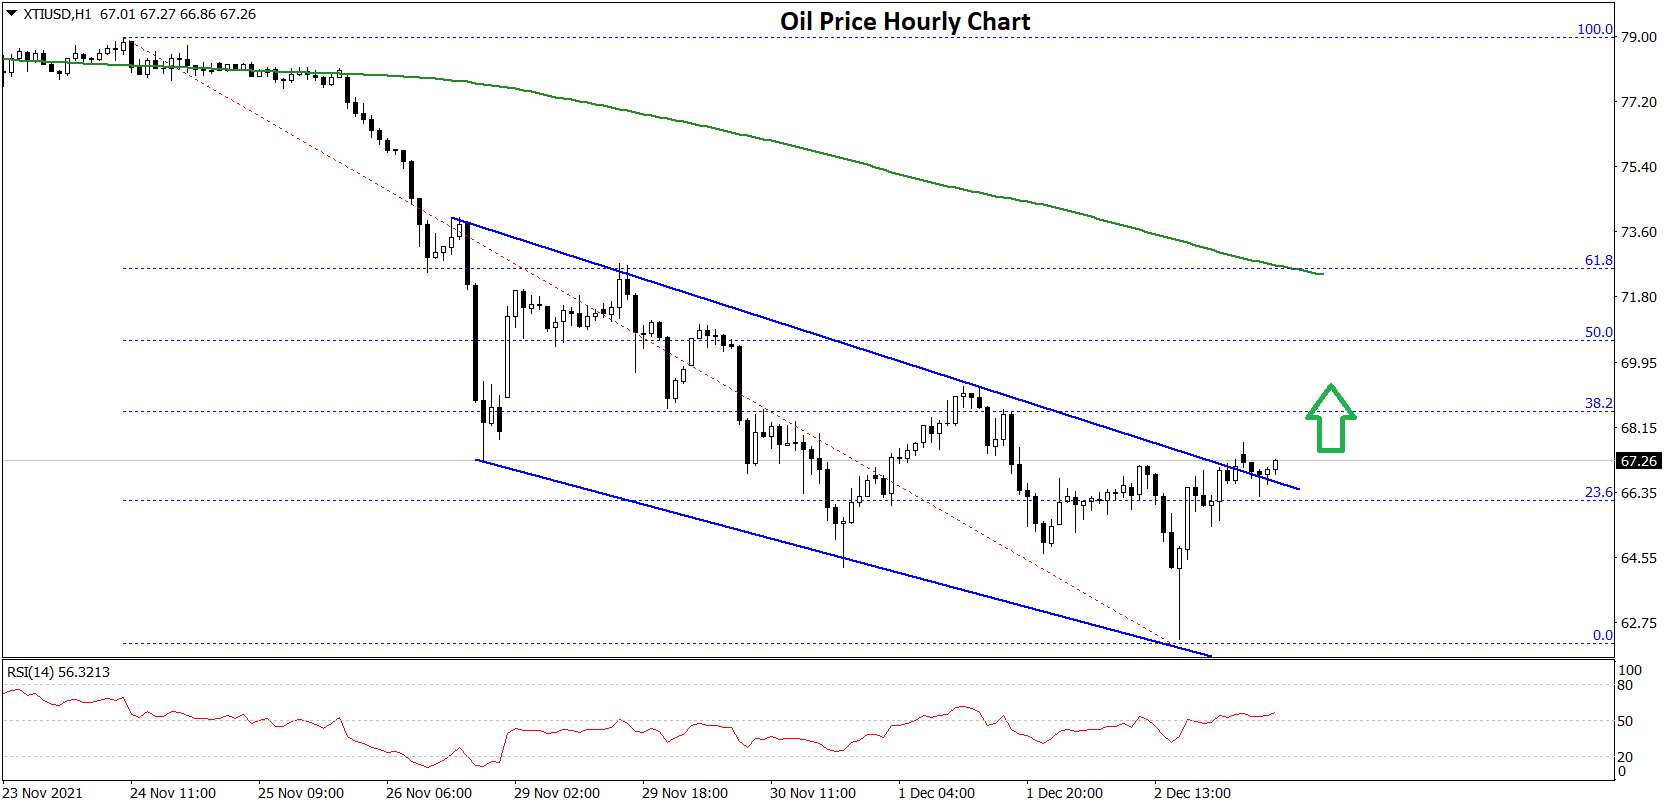
It corrected a few points above the $65.00 level. There was a break above the 23.6% Fib retracement level of the recent decline from the $80.00 resistance zone to $62.60 low.
Besides, there was a break above a major declining channel with resistance near $66.50 on the hourly chart of XTI/USD. The price is now facing resistance near the $68.00 level. The next key resistance is near the $70.00 level.
The 50% Fib retracement level of the recent decline from the $80.00 resistance zone to $62.60 low is also near the $70.00 level, above which the price could rise steadily.
On the downside, an initial support is near the $66.50 level. The first key support is near the $65.00 level, below which there is a risk of a larger decline. The next major support sits near the $62.50 level.
This forecast represents FXOpen Markets Limited opinion only, it should not be construed as an offer, invitation or recommendation in respect to FXOpen Markets Limited products and services or as financial advice.
This article represents the opinion of the Companies operating under the FXOpen brand only. It is not to be construed as an offer, solicitation, or recommendation with respect to products and services provided by the Companies operating under the FXOpen brand, nor is it to be considered financial advice.
Stay ahead of the market!
Subscribe now to our mailing list and receive the latest market news and insights delivered directly to your inbox.

Latest articles

WTI: Falling Production and Deadlock in Negotiations
Fundamental Background
As a result of the military conflict between the United States and Iran, the combined volume of halted oil production in Iraq, Saudi Arabia, Kuwait, the UAE, Qatar and Bahrain reached 10.5 million barrels per day in

Market Analysis: Gold Slips As WTI Crude Oil Rally Gains Fresh Momentum
Gold price extended losses below $4,650 before the bulls appeared. WTI Crude oil prices are rising and could climb further higher toward $105.
Important Takeaways for Gold and WTI Crude Oil Prices Analysis Today
· Gold price failed to clear

Fed vs ECB vs BOJ — Key Considerations for H2 2026
At the start of 2026, markets expected Fed cuts, BOJ hikes, and an ECB pause.
But rising inflation, higher energy prices, resilient US growth, and shifting central bank rhetoric are forcing traders to rethink the entire macro outlook for H2