


Gold Price And Crude Oil Price Approaching Resistance
FXOpen

Gold price recovered nicely from the $1,480 support area and climbed above $1,500. Crude oil price is correcting gains and it is facing hurdles near $60.00.
Important Takeaways for Gold and Oil
- Gold price started a decent upward move after it tested the $1,480 support area against the US Dollar.
- There is a major bearish trend line forming with resistance near $1,508 on the hourly chart of gold.
- Crude oil price is currently declining and trading close to the $58.00 support area.
- There is a key bearish trend line forming with resistance near $59.20 on the hourly chart of XTI/USD.
Gold Price Technical Analysis
Earlier this week, gold price declined sharply below the $1,500 support area against the US Dollar. The price even traded below the $1,490 support level and traded close to the $1,480 support area.
A swing low was formed near $1,483 on FXOpen and the price recently started a fresh increase. It broke the $1,490 and $1,495 resistance levels to move into a positive zone.
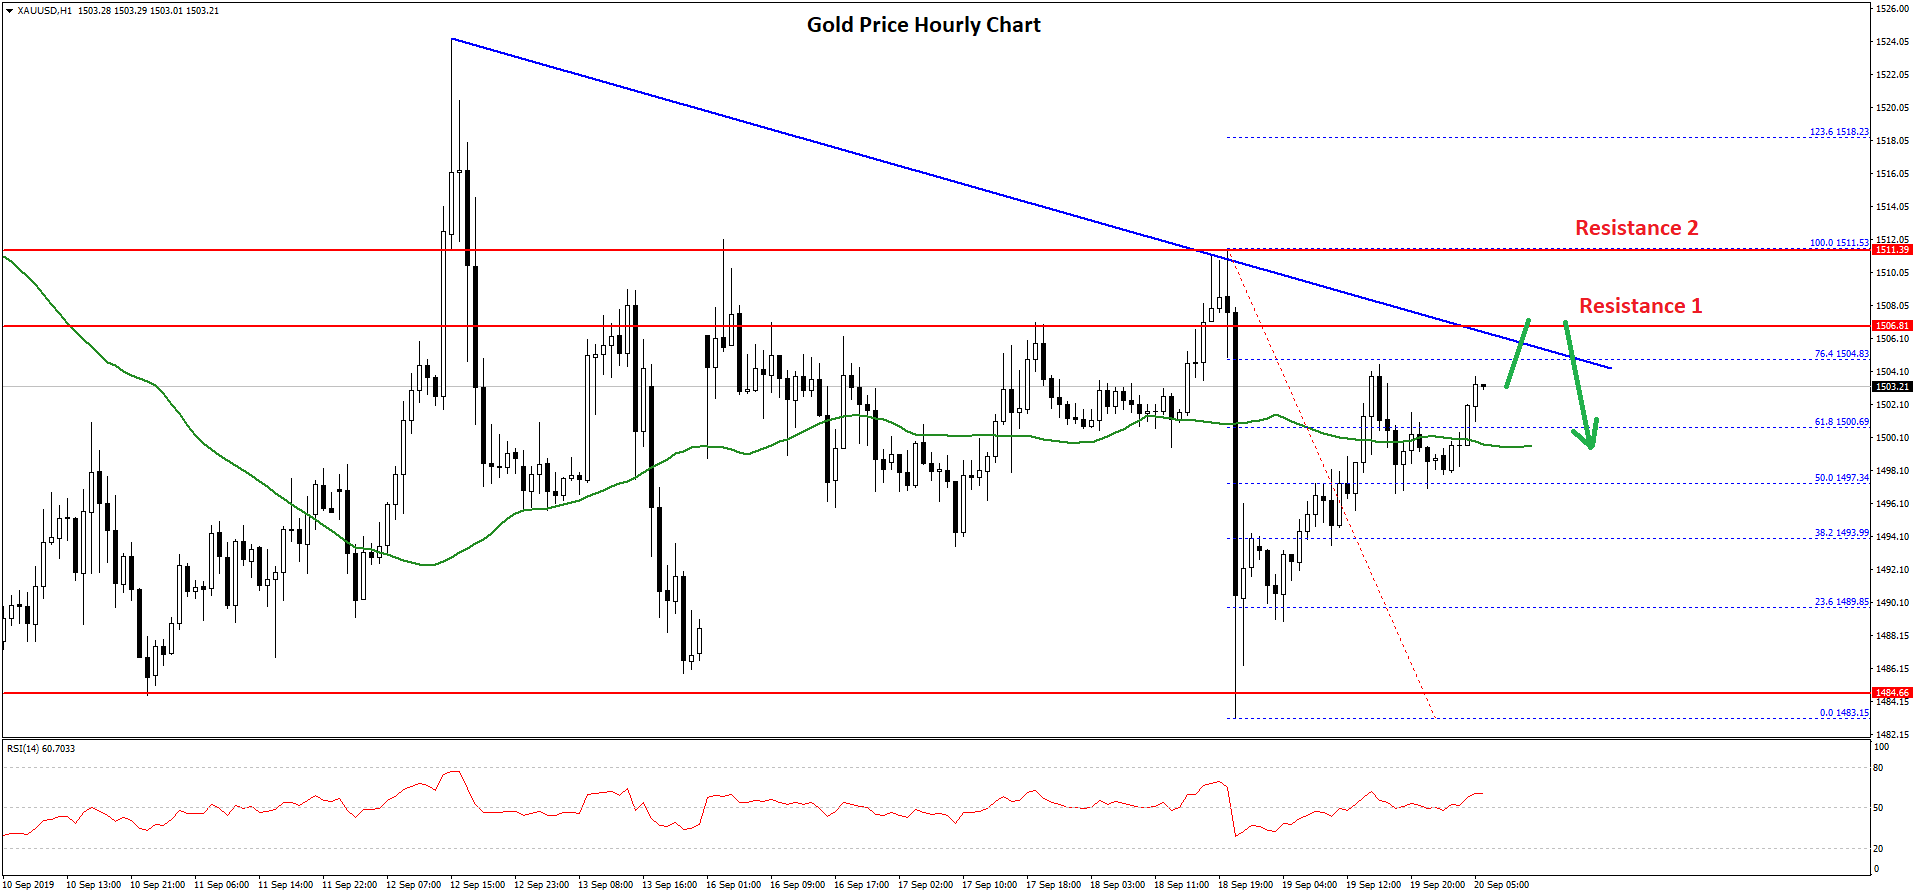
Moreover, there was a break above the 50% Fib retracement level of the last decline from the $1,511 high to $1,483 low. The price is now trading above the $1,500 level and the 50 hourly simple moving average.
An immediate resistance is near the $1,505 level, plus the 76.4% Fib retracement level of the last decline from the $1,511 high to $1,483 low. Moreover, there is a major bearish trend line forming with resistance near $1,508 on the hourly chart of gold.
Therefore, the price is likely to struggle to clear the $1,505 and $1,510 resistance levels. If there is an upside break, the price could climb towards the $1,525 and $1,530 levels.
On the downside, an immediate support is near the $1,500 level. If the price fails to stay above $1,500 or the 50 hourly SMA, there is a risk of a fresh decline towards the $1,485 and $1,480 levels.
Oil Price Technical Analysis
This week, crude oil price opened with a strong upward move and a gap above the $60.00 level against the US Dollar. The price surged above the $62.00 level and traded close to the $63.00 level.
A high was formed near $63.04 and the price recently started a downside correction. It broke the $61.20 and $60.00 support levels. Moreover, there was a break below the 50% Fib retracement level of the last major move from the $53.92 low to $63.04 high.
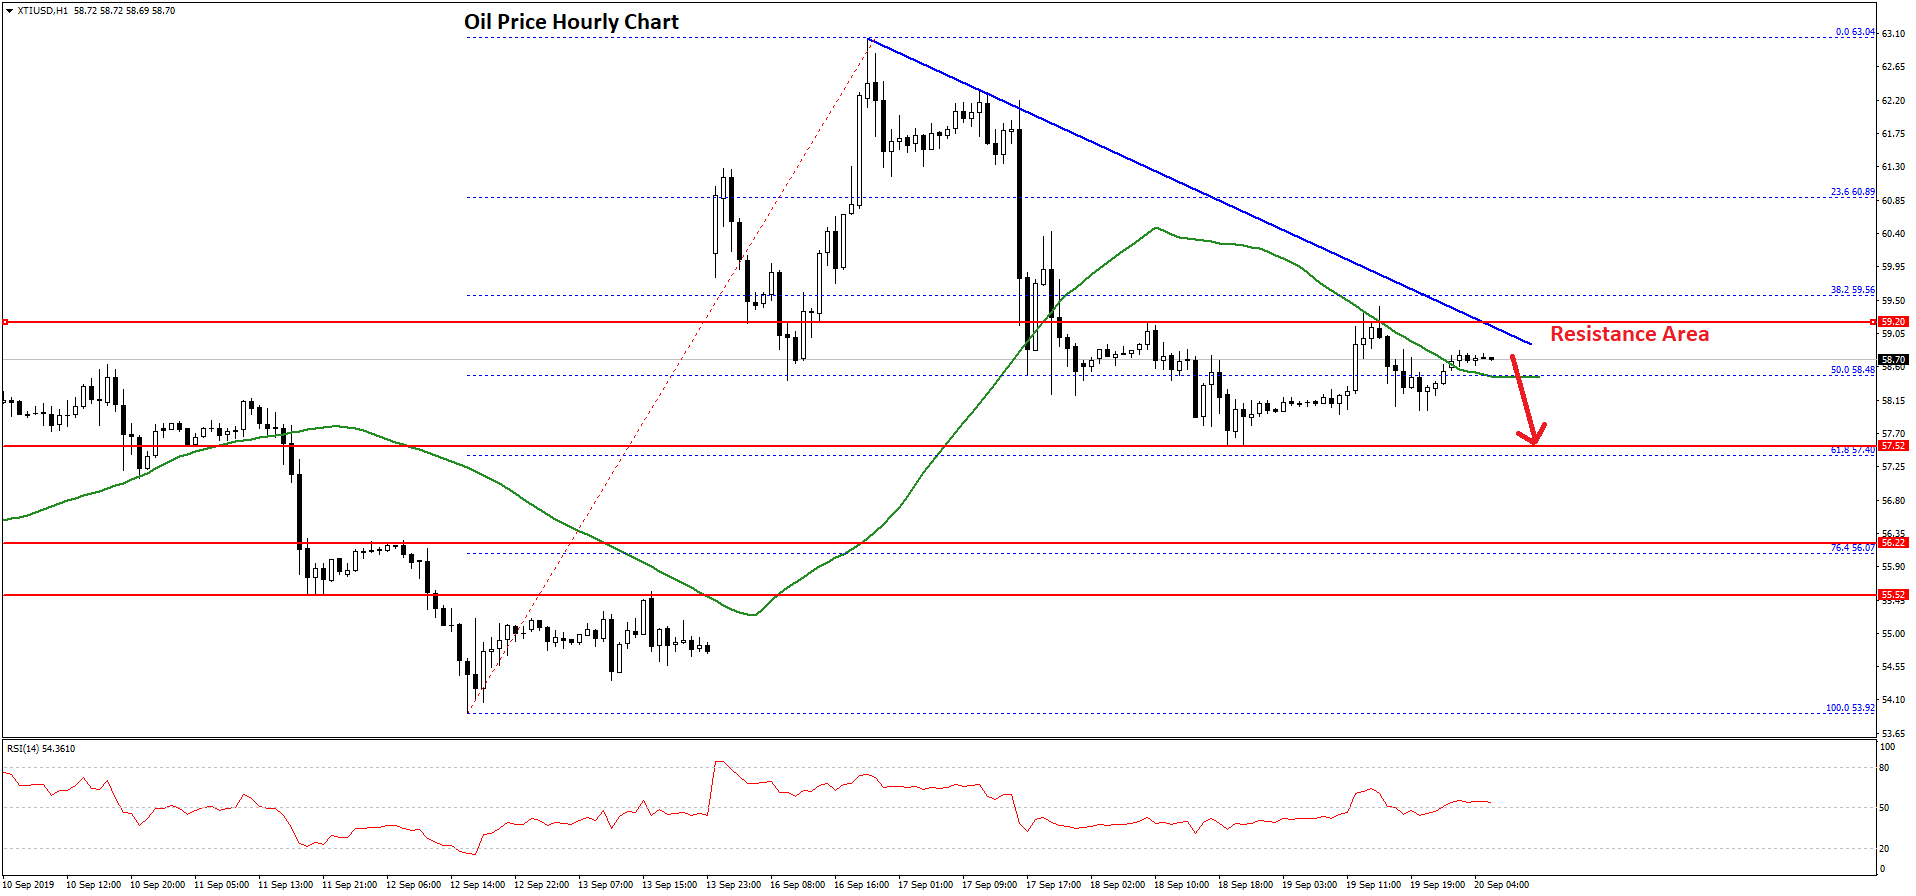
The price even traded below the 50 hourly simple moving average and tested the $58.00 support area. It seems like the 61.8% Fib retracement level of the last major move from the $53.92 low to $63.04 high is acting as a support.
The price is currently consolidating above the $58.00 level and the 50 hourly simple moving average. On the upside, there is a strong resistance forming near the $60.00 level.
There is also a key bearish trend line forming with resistance near $59.20 on the hourly chart of XTI/USD. Therefore, a break above the $59.00 and $59.20 resistance levels is needed for a fresh increase above the $60.00 resistance.
Conversely, the bears might push the price further lower below $58.00 to close the opening week gap. The next key supports are near the $56.00 and $55.50 levels.
Trade over 50 forex markets 24 hours a day with FXOpen. Take advantage of low commissions, deep liquidity, and spreads from 0.0 pips (additional fees may apply). Open your FXOpen account now or learn more about trading forex with FXOpen.
This article represents the opinion of the Companies operating under the FXOpen brand only. It is not to be construed as an offer, solicitation, or recommendation with respect to products and services provided by the Companies operating under the FXOpen brand, nor is it to be considered financial advice.
Stay ahead of the market!
Subscribe now to our mailing list and receive the latest market news and insights delivered directly to your inbox.


Latest articles

Apple: Earnings Day Above the Activity Zone
On 30 April, after the market close, Apple Inc. will release its financial results for the second quarter of fiscal 2026. The consensus forecast, based on estimates from 31 analysts, points to revenue of around $109.7 billion, with expected

USD/JPY and USD/CHF Near Key Levels: The Dollar Supported by the Fed
The US dollar continues to trend upwards following the Federal Reserve meeting, drawing support from the regulator’s moderately hawkish stance and comments by Jerome Powell. Markets interpret the Fed’s rhetoric as a signal that restrictive policy is likely

EUR/USD and GBP/USD consolidate ahead of the Fed decision
European currencies are showing subdued dynamics, entering a consolidation phase following their previous advance. Earlier, EUR/USD and GBP/USD broke out of their ranges and strengthened; however, the subsequent correction has led both pairs to retest the previously breached