


Gold Price and Crude Oil Price At Risk of More Losses
FXOpen

Gold price started a fresh decline below the $1,685 support zone. Crude oil price is also struggling and remains at a risk of more losses.
Important Takeaways for Gold and Oil
· Gold price started a fresh decline after it failed to stay above $1,700 against the US Dollar.
· There is a key bearish trend line forming with resistance near $1,675 on the hourly chart of gold.
· Crude oil price also started a steady decline from the $90.00 zone.
· There was a break below a major bullish trend line with support near $87.50 on the hourly chart of XTI/USD.
Gold Price Technical Analysis
Gold price attempted to gain pace above the $1,735 level against the US Dollar. However, the price failed to stay above $1,720 and started a fresh decline.
There was a clear move below the $1,700 support zone and the 50 hourly simple moving average. The price declined below the $1,675 level to move into a bearish zone. The decline gained pace below the $1,670 level.
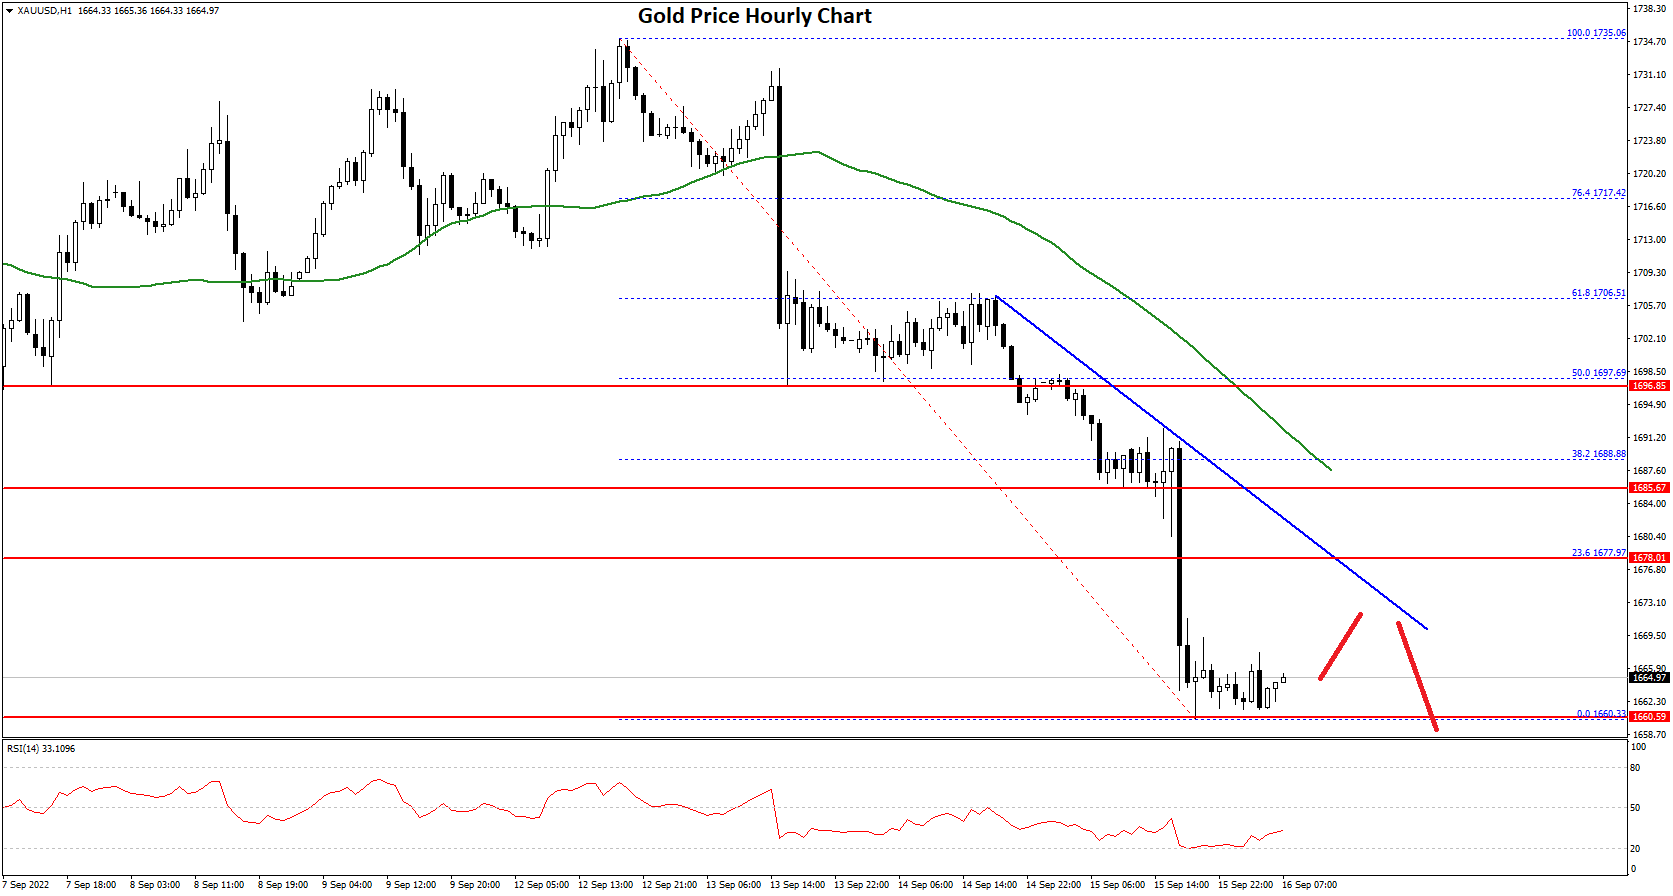
The price traded as low as $1,660 and is currently consolidating losses. On the upside, the price is facing resistance near the $1,670 level.
The first major resistance is near the $1,675 level. There is also a key bearish trend line forming with resistance near $1,675 on the hourly chart of gold. The trend line is near the 23.6% Fib retracement level of the recent decline from the $1,735 swing high to $1,660 low.
The main resistance is now forming near the $1,688 level and the 50 hourly simple moving average, above which it could even test the 50% Fib retracement level of the recent decline from the $1,735 swing high to $1,660 low.
A clear upside break above the $1,700 resistance could send the price towards $1,735. An immediate support on the downside is near the $1,660 level. The next major support is near the $1,650 level, below which there is a risk of a larger decline. In the stated case, the price could decline sharply towards the $1,620 support zone.
Oil Price Technical Analysis
Crude oil price started a fresh decline from the $90.00 resistance zone against the US Dollar. The price traded below the $88.00 support zone to move into a short-term bearish zone.
During the decline, there was a break below a major bullish trend line with support near $87.50 on the hourly chart of XTI/USD. The price even settled below the $87.00 level and the 50 hourly simple moving average.
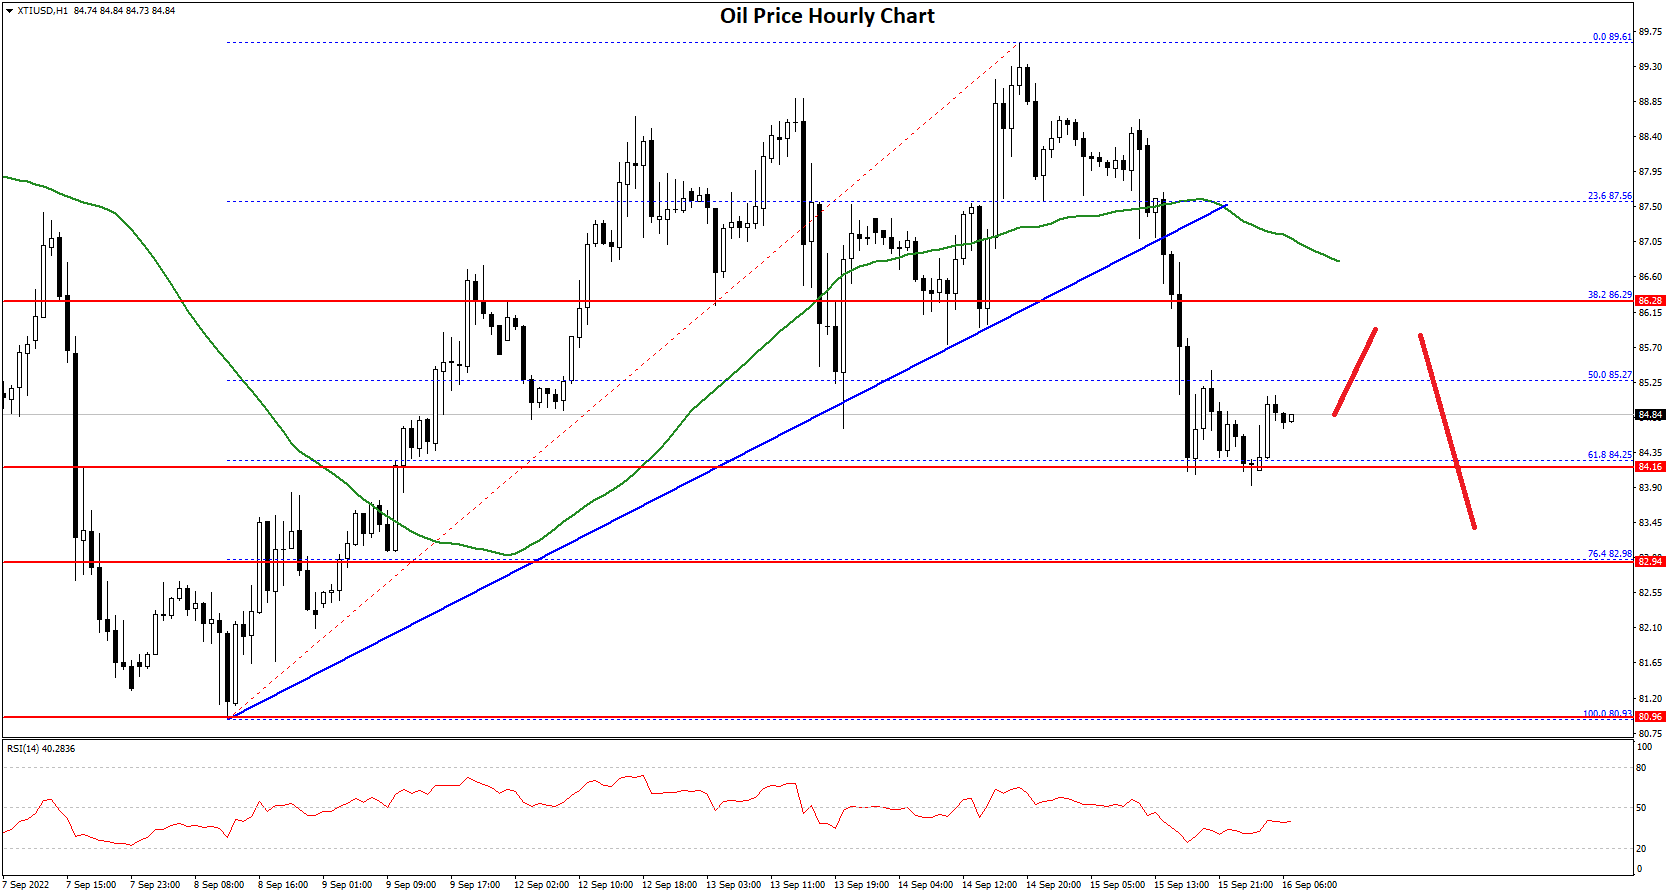
There was also a move below the 50% Fib retracement level of the upward move from the $80.93 swing low to $89.61 high. The price is now consolidating near the $84.50 level.
On the downside, an immediate support is near the $84.25 level. It is near the 61.8% Fib retracement level of the upward move from the $80.93 swing low to $89.61 high. The next major support is near the $83.00 level.
If there is a downside break, the price might decline towards $81.50. Any more losses may perhaps open the doors for a move towards the $80.00 support zone.
On the upside, the price might face sellers near the $86.20 level. The next key resistance is near the $87.00 level and the 50 hourly simple moving average. The main resistance sits near the $88.0 level, above which the price might accelerate higher towards $90.00 or even $92.00.
This forecast represents FXOpen Markets Limited opinion only, it should not be construed as an offer, invitation or recommendation in respect to FXOpen Markets Limited products and services or as financial advice.
Trade over 50 forex markets 24 hours a day with FXOpen. Take advantage of low commissions, deep liquidity, and spreads from 0.0 pips (additional fees may apply). Open your FXOpen account now or learn more about trading forex with FXOpen.
This article represents the opinion of the Companies operating under the FXOpen brand only. It is not to be construed as an offer, solicitation, or recommendation with respect to products and services provided by the Companies operating under the FXOpen brand, nor is it to be considered financial advice.
Stay ahead of the market!
Subscribe now to our mailing list and receive the latest market news and insights delivered directly to your inbox.


Latest articles

Nasdaq 100: Is This the Correction Traders Have Been Waiting For?
The Nasdaq 100 (US Tech 100 Mini on FXOpen) remains caught between two opposing forces: cooling inflation on one side, and persistent geopolitical instability on the other. On 14 July, June's CPI print came in softer than expected, easing near-term

XRP/USD: Symmetrical Triangle Forms as Trading Volume Fades
On 6 July, Ripple received a full Crypto-Asset Service Provider (CASP) licence under the Markets in Crypto-Assets (MiCA) regulation from Luxembourg's financial regulator, the CSSF. The approval allows the company to offer regulated crypto payment services across all 30 countries

AI Valuations Are Back in the Spotlight
Artificial intelligence remains the dominant investment theme of 2026, but investors are increasingly questioning whether AI stock valuations are keeping pace with reality.
💰 Big Tech continues to invest at an unprecedented scale, with hyperscaler AI spending projected to exceed $800