


FXOpen

Gold price is trading in a positive zone above the $1,850 support. Crude oil price must clear $80.00 to start a fresh increase in the near term.
Important Takeaways for Gold and Oil
· Gold price started a decent increase above the $1,850 resistance against the US Dollar.
· There is a key contracting triangle forming with resistance near $1,865 on the hourly chart of gold.
· Crude oil price corrected lower below $80.00 and tested the $76.50 zone.
· There was a break above a key bearish trend line with resistance near $78.50 on the hourly chart of XTI/USD.
Gold Price Technical Analysis
Gold price started a fresh increase above the $1,820 resistance level against the US Dollar. The price gained pace and it was able to settle above the $1,842 resistance zone.
The price even settled above the $1,850 level and the 50 hourly simple moving average. Finally, there was a break above the $1,870 level. A high was formed near $1,877 on FXOpen and the price corrected lower. There was a break below the $1,865 level, but the bulls remained active near $1,850.
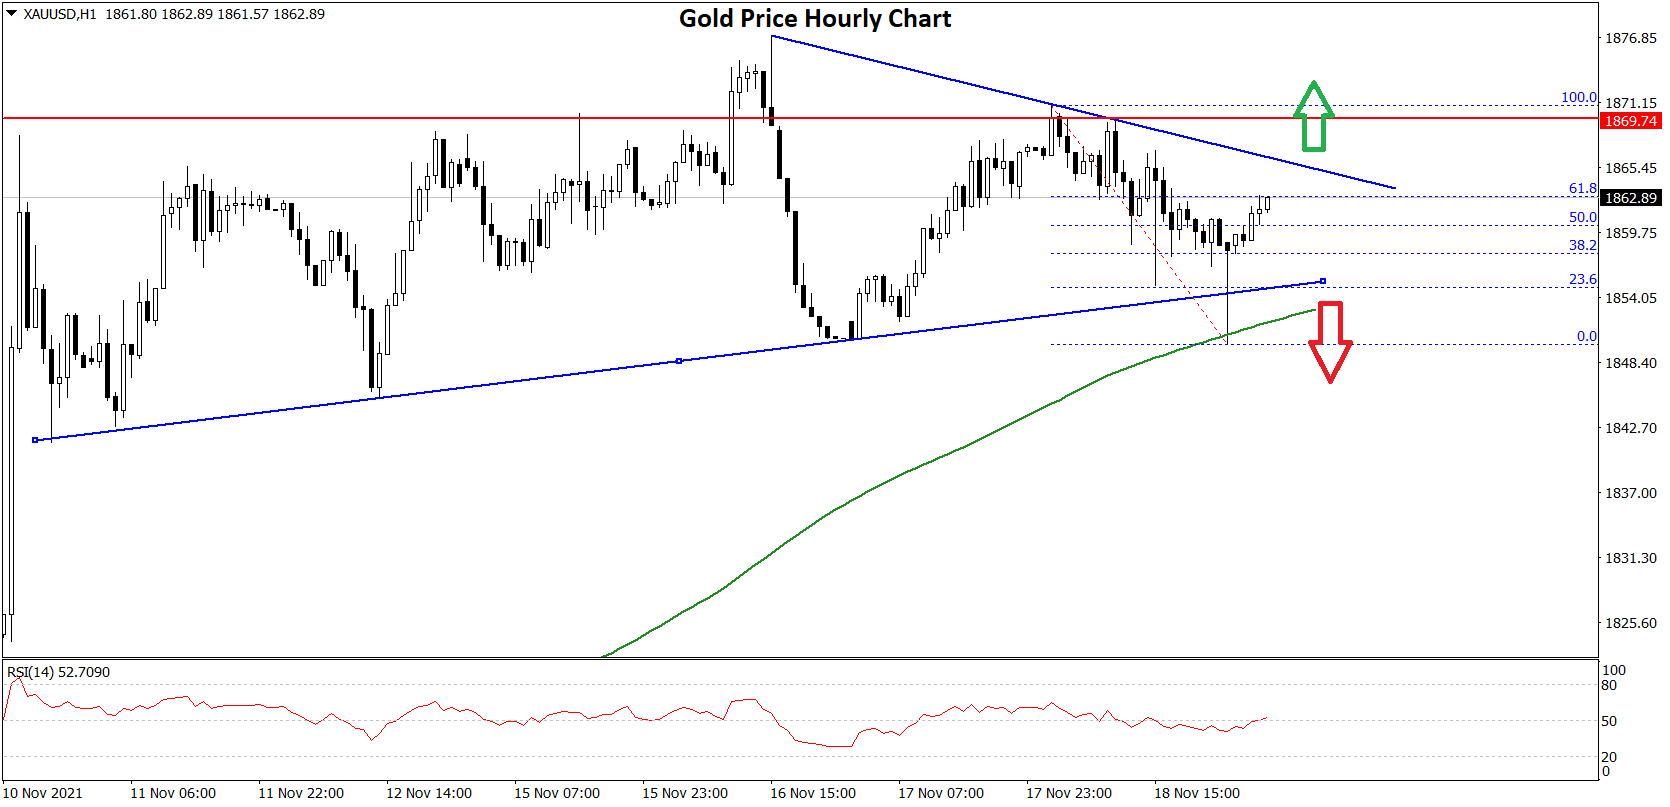
A low is formed near $1,850 and the price is now rising. The price is back above the $1,860 level and the 50 hourly simple moving average. It also surpassed the 50% Fib retracement level of the recent decline from the $1,871 swing high to $1,850 low.
An immediate resistance on the upside is near the $1,863 level. It is near the 61.8% Fib retracement level of the recent decline from the $1,871 swing high to $1,850 low. The first major resistance is near the $1,865 level.
There is also a key contracting triangle forming with resistance near $1,865 on the hourly chart of gold. The main resistance is near the $1,870 level. A close above the $1,870 level could open the doors for a steady increase towards $1,885.
The next major resistance sits near the $1,900 level. On the downside, an initial support is near the $1,855 level. The first major support is near the $1,850 level. A downside break below the $1,850 support zone may possibly spark a steady decline. In the stated case, the price could test the $1,820 support.
Oil Price Technical Analysis
Crude oil price failed to continue higher above $82.50 and started a steady decline against the US Dollar. The price traded below the $80.00 support to move into a bearish zone.
The price even traded below $78.00 and settled below the 50 hourly simple moving average. A low is formed near $76.32 and the price is now correcting higher. There was a break above the $77.50 and $78.00 resistance levels.
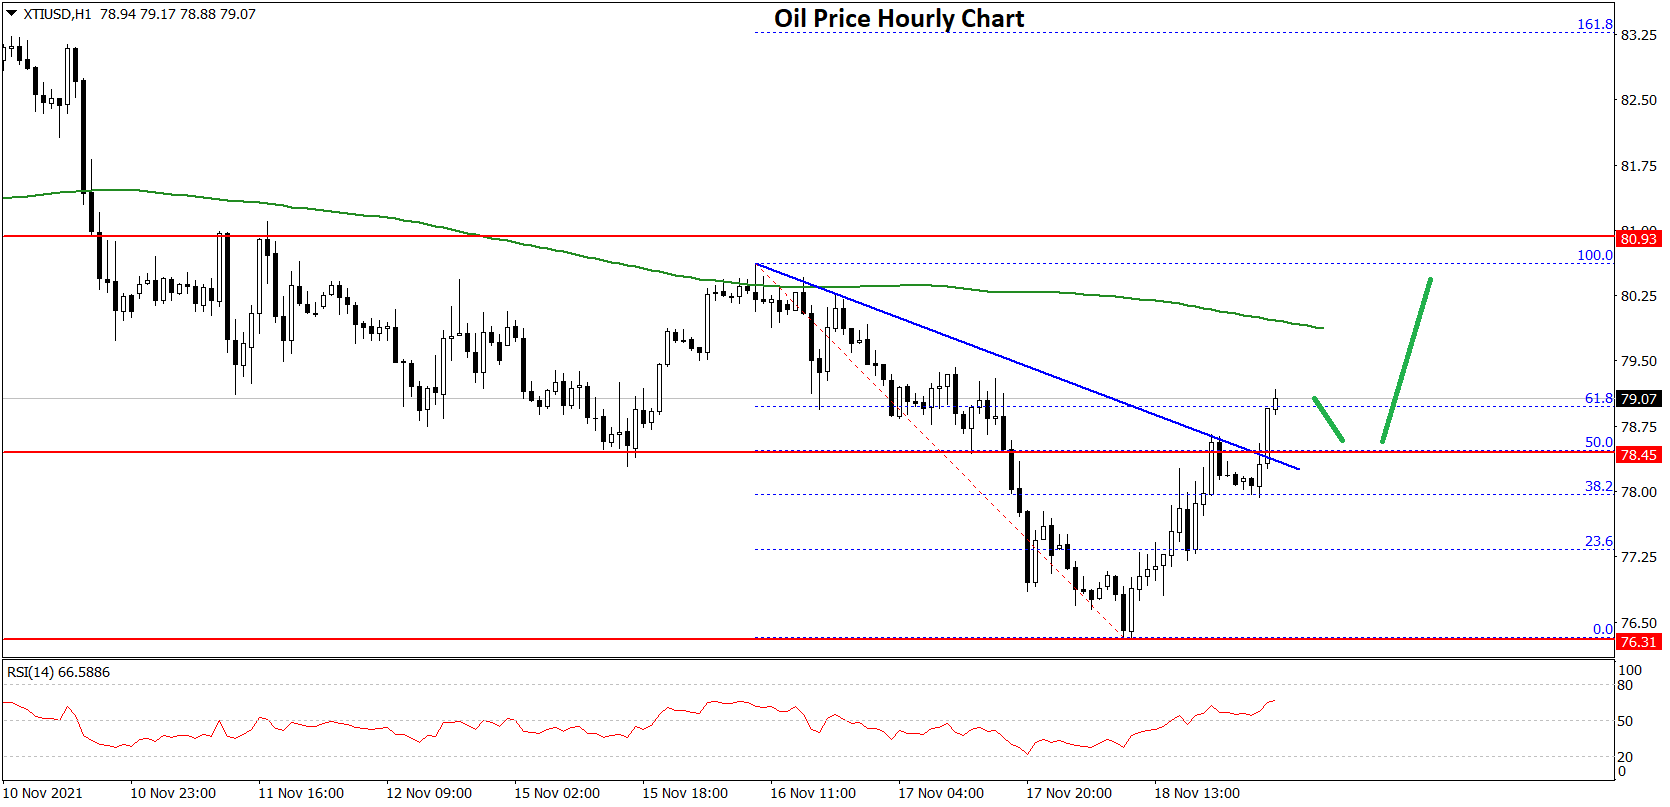
Besides, there was a break above a key bearish trend line with resistance near $78.50 on the hourly chart of XTI/USD. The pair traded above the 50% Fib retracement level of the recent decline from the $80.61 swing high to $76.32 low.
On the upside, the price is facing resistance near the $79.20 level. The next key resistance is near the $80.00 level and the 50 SMA, above which the price might accelerate higher towards $82.00.
On the downside, an initial support is near the $78.00 level. The first key support is near the $76.50 level, below which there is a risk of a larger decline. The next major support sits near the $75.00 level.
This forecast represents FXOpen Markets Limited opinion only, it should not be construed as an offer, invitation or recommendation in respect to FXOpen Markets Limited products and services or as financial advice.
Trade over 50 forex markets 24 hours a day with FXOpen. Take advantage of low commissions, deep liquidity, and spreads from 0.0 pips (additional fees may apply). Open your FXOpen account now or learn more about trading forex with FXOpen.
This article represents the opinion of the Companies operating under the FXOpen brand only. It is not to be construed as an offer, solicitation, or recommendation with respect to products and services provided by the Companies operating under the FXOpen brand, nor is it to be considered financial advice.
Stay ahead of the market!
Subscribe now to our mailing list and receive the latest market news and insights delivered directly to your inbox.


Latest articles

Nvidia (NVDA) Shares Set a March High
Nvidia shares experienced heightened volatility yesterday, with the price jumping to a March high during the Nvidia GTC 2026 conference, where Jensen Huang made several major announcements. According to media reports:
→ Nvidia unveiled a next-generation platform named after the astronomer

XTI/USD Chart Analysis: WTI Oil Price Fluctuates Near $100
For the third Monday in a row, trading in the oil market has opened with a bullish gap, although this time it is not as wide as the gap seen, for example, on 9 March. The reason for the volatility

Gold Price Falls to a Monthly Low
As the XAU/USD chart shows, gold prices today dropped below the 3 March low, reaching levels last seen in the third week of February.
Why Is Gold Declining Despite the War?
Geopolitical turmoil typically supports demand for gold as