


FXOpen

Gold price is facing resistance near $1,790 and $1,800. Crude oil price remains elevated above the key $80.00 pivot level and it is eyeing more upsides.
Important Takeaways for Gold and Oil
· Gold price started a decent increase above the $1,760 resistance against the US Dollar.
· There was a break above a major contracting triangle with resistance near $1,785 on the hourly chart of gold.
· Crude oil price extended its rally towards the $83.70 level before it started a downside correction.
· There is a key bullish trend line forming with support near $81.30 on the hourly chart of XTI/USD.
Gold Price Technical Analysis
Gold price started a fresh increase above the $1,750 pivot level against the US Dollar. The price gained pace and it was able to settle above the $1,780 resistance zone.
A high was formed near $1,800 on FXOpen and the price corrected lower. There was a break below the $1,780 and $1,775 levels. However, the bulls were active above the $1,750 level. A low was formed near $1,760 and the price is now rising.
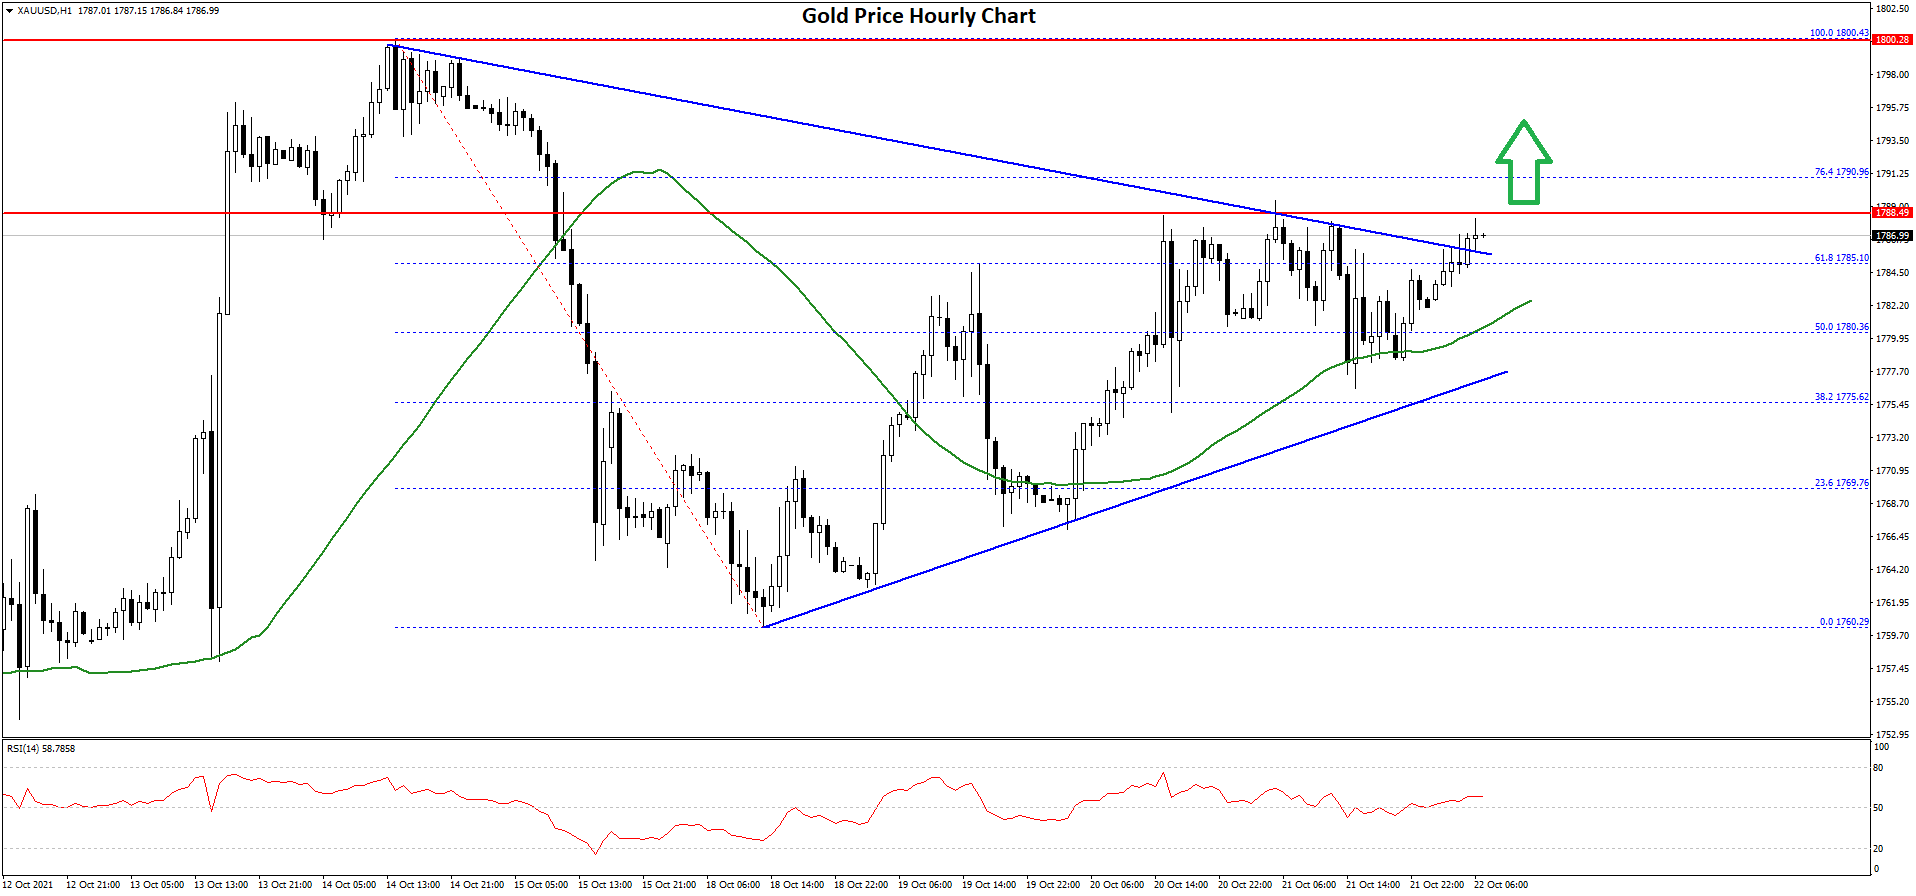
The price is back above the $1,780 level and the 50 hourly simple moving average. It also surpassed the 50% Fib retracement level of the key drop from the $1,800 swing high to $1,760 low.
There was also a break above a major contracting triangle with resistance near $1,785 on the hourly chart of gold. An immediate resistance on the upside is near the $1,788 and $1,790 levels. It is near the 76.4% Fib retracement level of the key drop from the $1,800 swing high to $1,760 low.
The first major resistance is near the $1,792 level. The main resistance is near the $1,800 level. A close above the $1,800 level could open the doors for a move towards $1,820.
On the downside, the first major support is near the $1,782 level and the 50 SMA. A downside break below the $1,762 support zone may possibly call for a test of the $1,765 support zone in the near term.
Oil Price Technical Analysis
Crude oil price started a major increase from the $78.80 support zone against the US Dollar. The price broke the $80.00 resistance zone to move into a positive zone.
The price even cleared the $82.00 level and settled above the 50 hourly simple moving average. A high was formed near $83.70 before the price corrected lower. It corrected a few points below the $82.00 level.
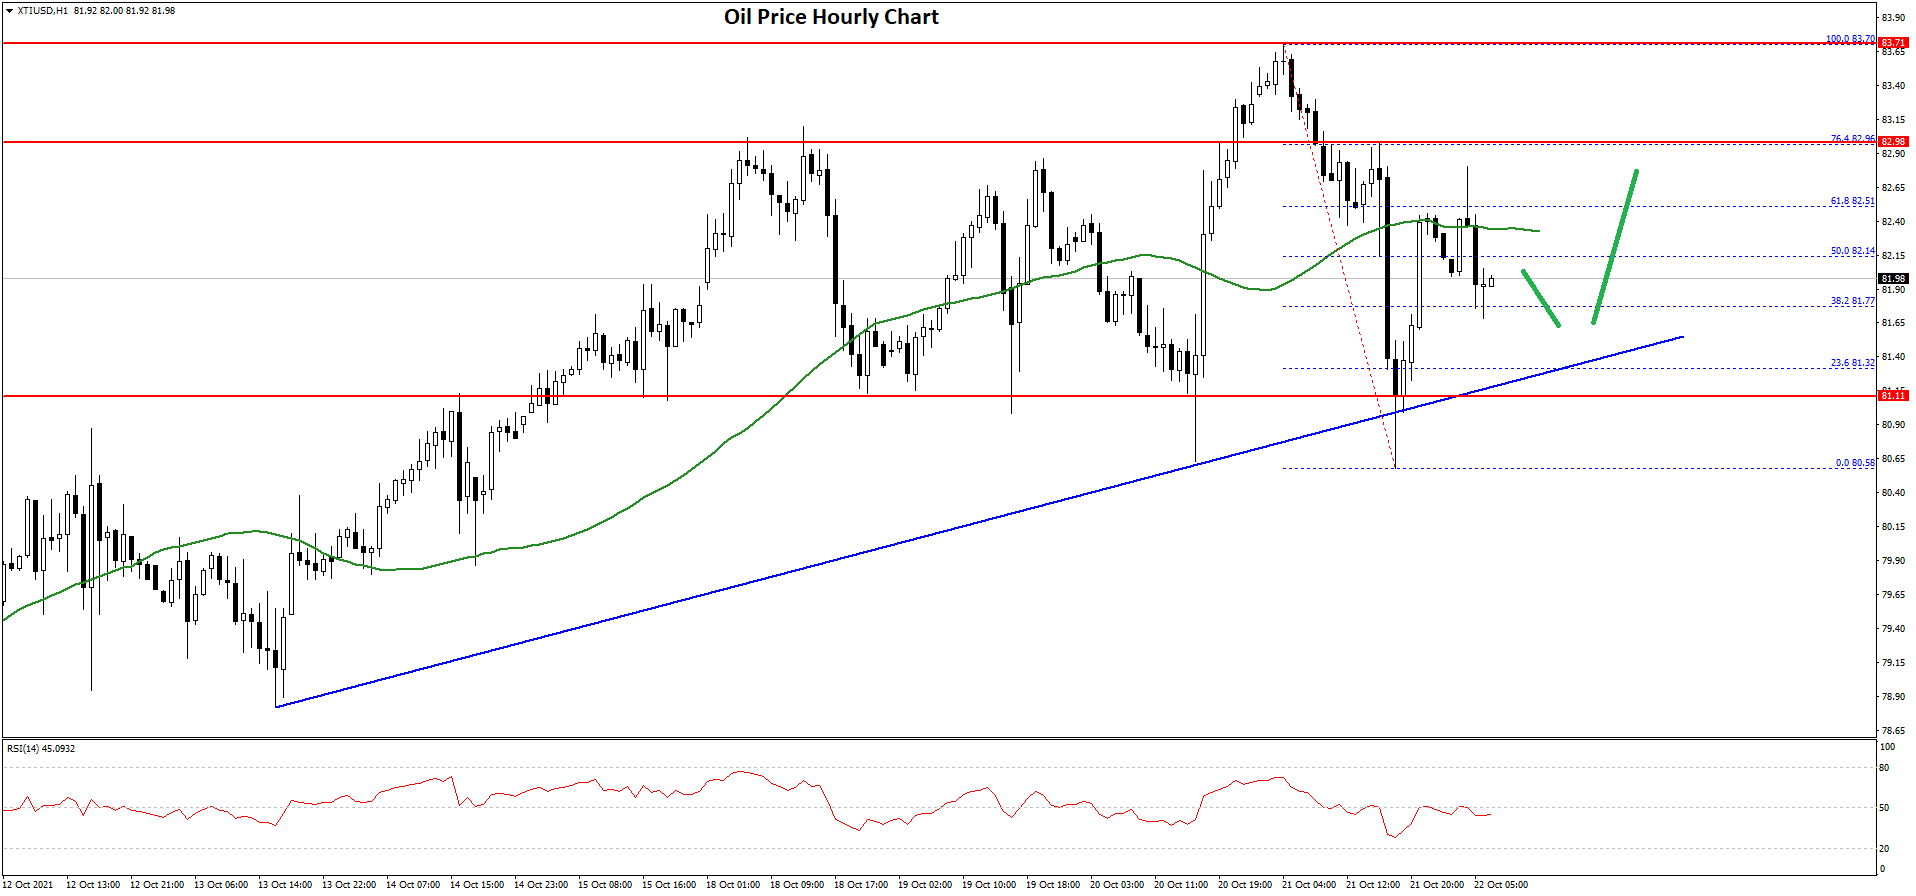
However, the price remained stable above the $80.00 level. The recent swing low was near $80.58 before the price started a fresh increase. There was a break above the 50% Fib retracement level of the downward move from the $83.70 swing high to $80.58 low.
On the upside, the price is facing resistance near the $82.50 level. It is near the 61.8% Fib retracement level of the downward move from the $83.70 swing high to $80.58 low. The next key resistance is near the $83.00 level, above which the price might accelerate higher towards $85.00.
On the downside, an initial support is near the $81.60 level. The first key support is near the $81.50 level. There is also a key bullish trend line forming with support near $81.30 on the hourly chart of XTI/USD.
If there is a downside break below the $81.30 level, the price could extend its decline towards the $80.00 level in the coming sessions.
This forecast represents FXOpen Markets Limited opinion only, it should not be construed as an offer, invitation or recommendation in respect to FXOpen Markets Limited products and services or as financial advice.
This article represents the opinion of the Companies operating under the FXOpen brand only. It is not to be construed as an offer, solicitation, or recommendation with respect to products and services provided by the Companies operating under the FXOpen brand, nor is it to be considered financial advice.
Stay ahead of the market!
Subscribe now to our mailing list and receive the latest market news and insights delivered directly to your inbox.

Latest articles

FX Markets Are Changing: What’s Driving Currencies Now?
FX markets have become increasingly reactive in March, with geopolitical developments—particularly the US–Iran conflict—driving price action across currencies, commodities, and interest rate expectations.
In this update, we examine the key forces shaping the FX market right now,

GBP/USD Rises Following Bank of England Decision
Yesterday, the Bank of England’s decision had a significant impact on the pound, which strengthened against other currencies. Although the Official Bank Rate remained unchanged at 3.75%, the market was surprised by the “hawkish” signals, which sharply contrasted
S&P 500 Analysis: Index Falls to Year-to-Date Low
As the S&P 500 chart (US SPX 500 mini on FXOpen) shows, the index dropped below the 6,570 level yesterday for the first time in 2026. As a result, the equity market may be on track to