


FXOpen

Gold price is gaining momentum above the $1,550 level, but it is facing hurdles. Similarly, crude oil price is facing a strong hurdle near the $51.80 and $52.00 levels.
Important Takeaways for Gold and Oil
- Gold price started a decent upward move from the $1,547 swing low against the US Dollar.
- There was a break above a key bearish trend line with resistance near $1,565 on the hourly chart of gold.
- Crude oil price is holding the key $50.00 and $50.40 support levels.
- There is a key bearish trend line forming with resistance near $51.80 on the hourly chart of XTI/USD.
Gold Price Technical Analysis
After a strong decline, gold price found support near the $1,547 and $1,548 levels against the US Dollar. A support base was formed above $1,545 and the price started a decent upward move from the $1,547 low (formed on FXOpen).
It broke the $1,550 and $1,555 resistance levels. Moreover, there was a close above the $1,560 level and the 50 hourly simple moving average.
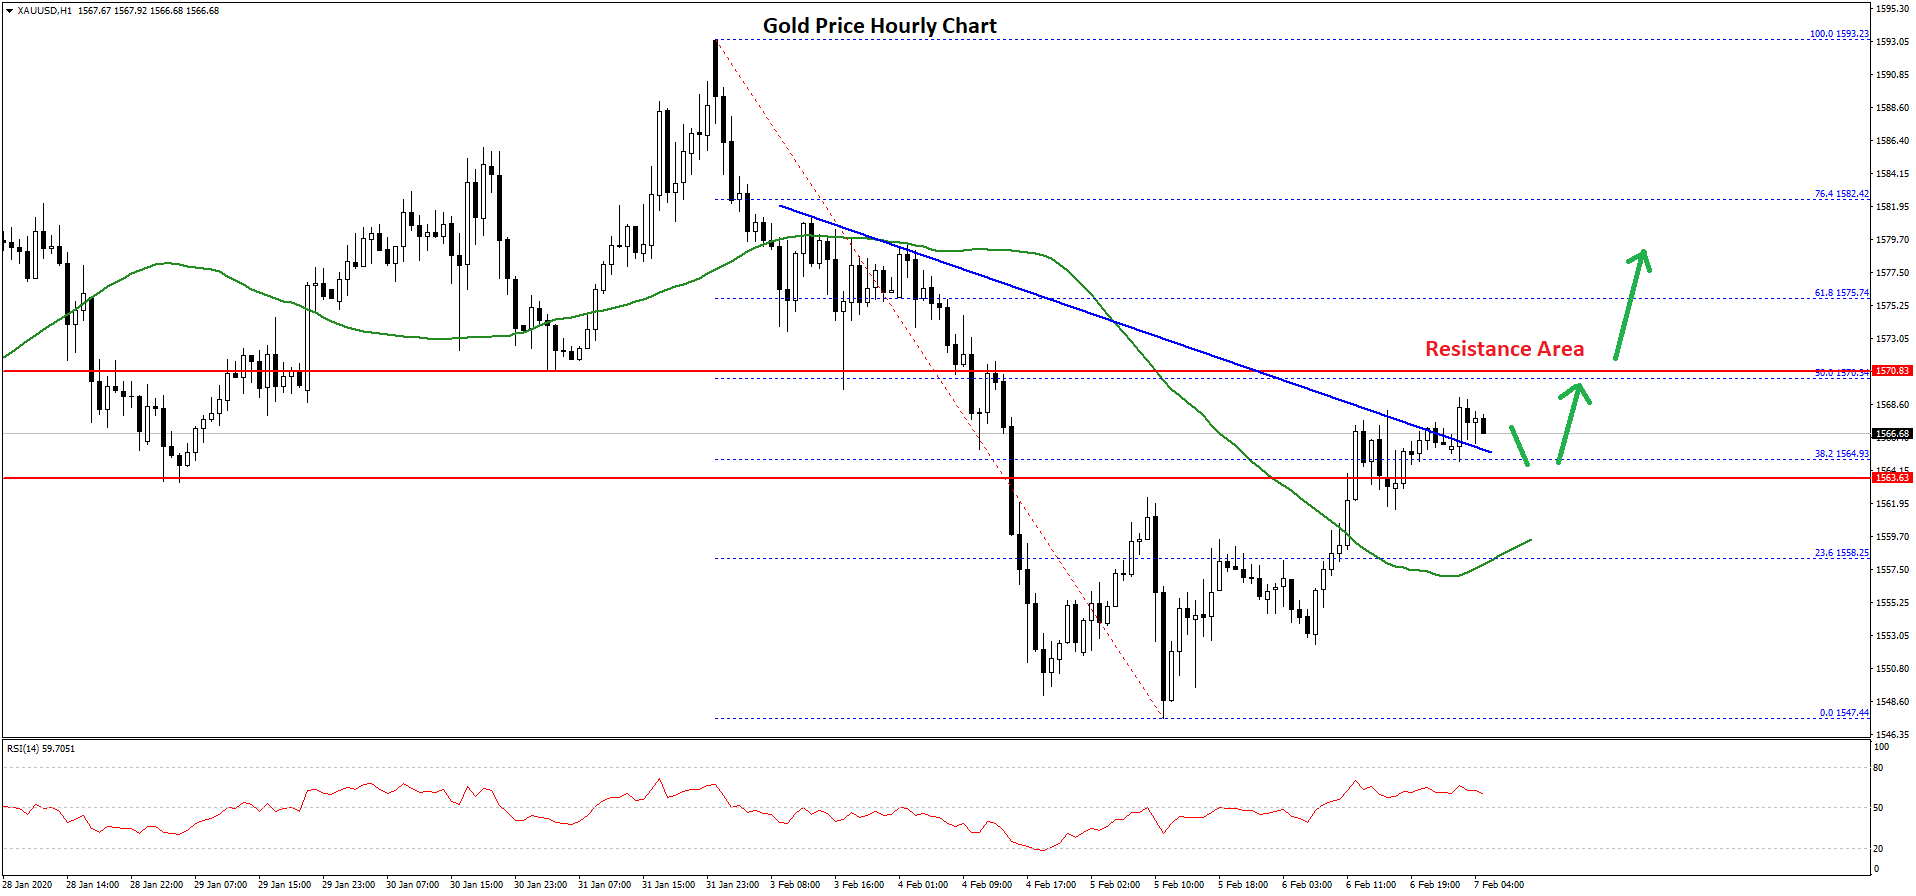
More importantly, there was a break above a key bearish trend line with resistance near $1,565 on the hourly chart of gold. The price even climbed above the 23.6% Fib retracement level of the downward move from the $1,593 high to $1,547 low.
On the upside, there is a strong resistance waiting near the $1,570 level. It coincides with the 50% Fib retracement level of the downward move from the $1,593 high to $1,547 low.
A clear break above the $1,570 resistance area could set the pace for more gains in the coming sessions. The next hurdle is seen near the $1,575 and $1,582 levels.
Any further gains could lead the price towards the $1,590 level. On the downside, an initial support is near the $1,562 level (the recent breakout zone). The main support is near the $1,560 level and the 50 hourly simple moving average.
Overall, gold price is trading nicely above $1,560, but it must surpass $1,570 to continue higher in the near term.
Oil Price Technical Analysis
In the past few days, there was a steady decline in crude oil price below the $55.00 support level against the US Dollar. The price traded below many key supports near the $52.50 and $52.00 levels.
It even broke the $50.00 support level and traded towards the $49.40 level. A low is formed near $49.38 and the price is currently recovering higher.
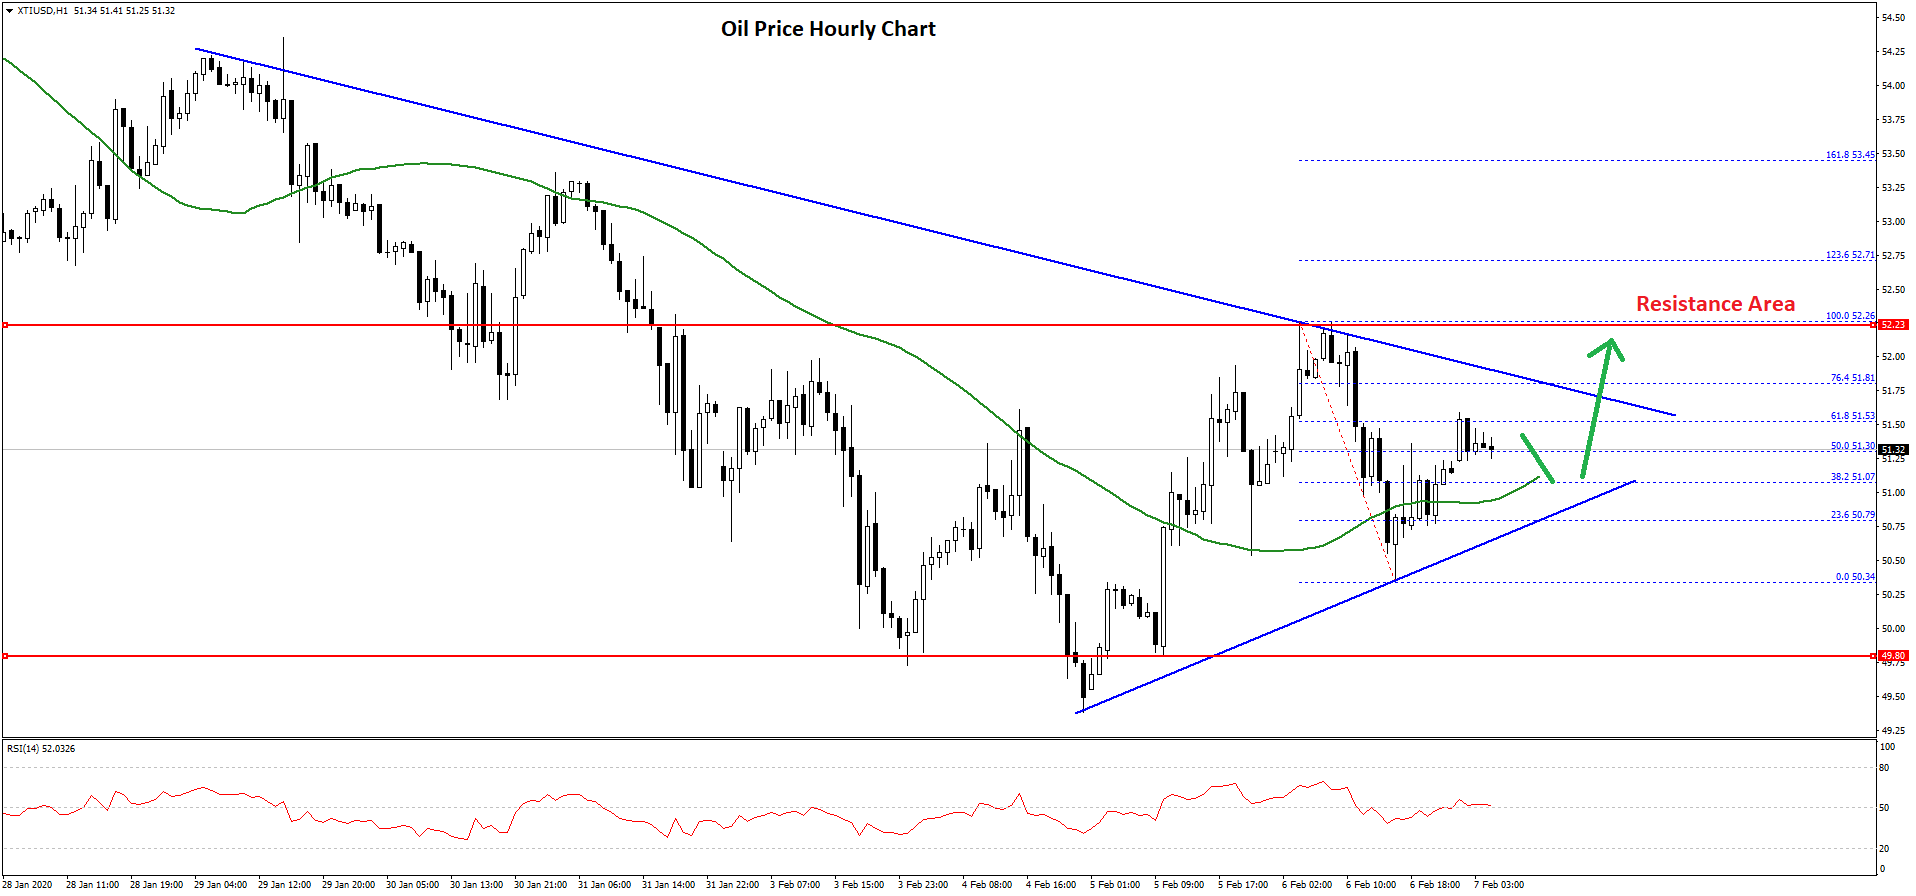
It surpassed the $50.50 resistance area and the 50 hourly simple moving average. Recently, it climbed above $51.50, but it struggled to gain pace above $52.25. It trimmed gains and revisited the $50.50 zone.
A low is formed near $50.34 and the price is currently rising. It is trading above the 50% Fib retracement level of the recent decline from the $52.26 high to $50.34 low.
However, there are many hurdles on the upside near $51.50 and $52.00. Besides, there is a key bearish trend line forming with resistance near $51.80 on the hourly chart of XTI/USD.
The trend line is close to the 76.4% Fib retracement level of the recent decline from the $52.26 high to $50.34 low. Therefore, crude oil price must climb above the $51.80 and $52.25 resistance levels to continue higher. If not, it might retest the $50.00 support area.
Trade over 50 forex markets 24 hours a day with FXOpen. Take advantage of low commissions, deep liquidity, and spreads from 0.0 pips. Open your FXOpen account now or learn more about trading forex with FXOpen.
This article represents the opinion of the Companies operating under the FXOpen brand only. It is not to be construed as an offer, solicitation, or recommendation with respect to products and services provided by the Companies operating under the FXOpen brand, nor is it to be considered financial advice.
Stay ahead of the market!
Subscribe now to our mailing list and receive the latest market news and insights delivered directly to your inbox.

Latest from Forex Analysis
Latest articles

Weekly Market Wrap With Gary Thomson: Nasdaq, EUR/USD, USD/CHF, Brent Crude Oil, Googl Shares
Get the latest scoop on the week's hottest headlines, all in one convenient video. Join Gary Thomson, the COO of FXOpen UK, as he breaks down the most significant news reports and shares his expert insights.
- Nasdaq Composite: Worst Session

Analysis of AUD/USD: Exchange Rate Falls to Early May Low
As indicated by the 4-hour AUD/USD chart today:
→ the rate fell below 0.652, a level last seen on May 2;
→ the RSI indicator dropped below 15, a level last seen during the panic over the spread of COVID-19

Analysis of AMZN Stock: Price at 1.5-Month Low
As shown in the AMZN chart, the stock price dropped below:
→ the psychological level of $180;
→ the mid-June interim low.
The last time AMZN traded below $180 was in early June.
Thus, AMZN has faced sell-offs, similar to other tech