


Gold Price And Crude Oil Price Facing Key Hurdles
FXOpen

Gold price remained in a strong uptrend and traded above the $1,750 level before correcting lower. Similarly, crude oil price started a strong increase and climbed above $30.00.
Important Takeaways for Gold and Oil
- Gold price traded as high as $1,764 before correcting lower against the US Dollar.
- There is a key resistance trend line forming with the current hurdle at $1,775 on the daily chart of gold.
- Crude oil price followed a strong bullish path and traded above $25.00 and $30.00.
- There was a break above a key bearish trend line with resistance near $26.50 on the daily chart of XTI/USD.
Gold Price Technical Analysis
Gold price remained in a bullish zone above the $1,700 resistance zone against the US Dollar. There was a clear break above the $1,725 and $1,750 resistance levels.
The price traded to a new yearly high at $1.764 on FXOpen and settled well above the 50-day simple moving average. Recently, there was a downside correction from the $1,764 high.
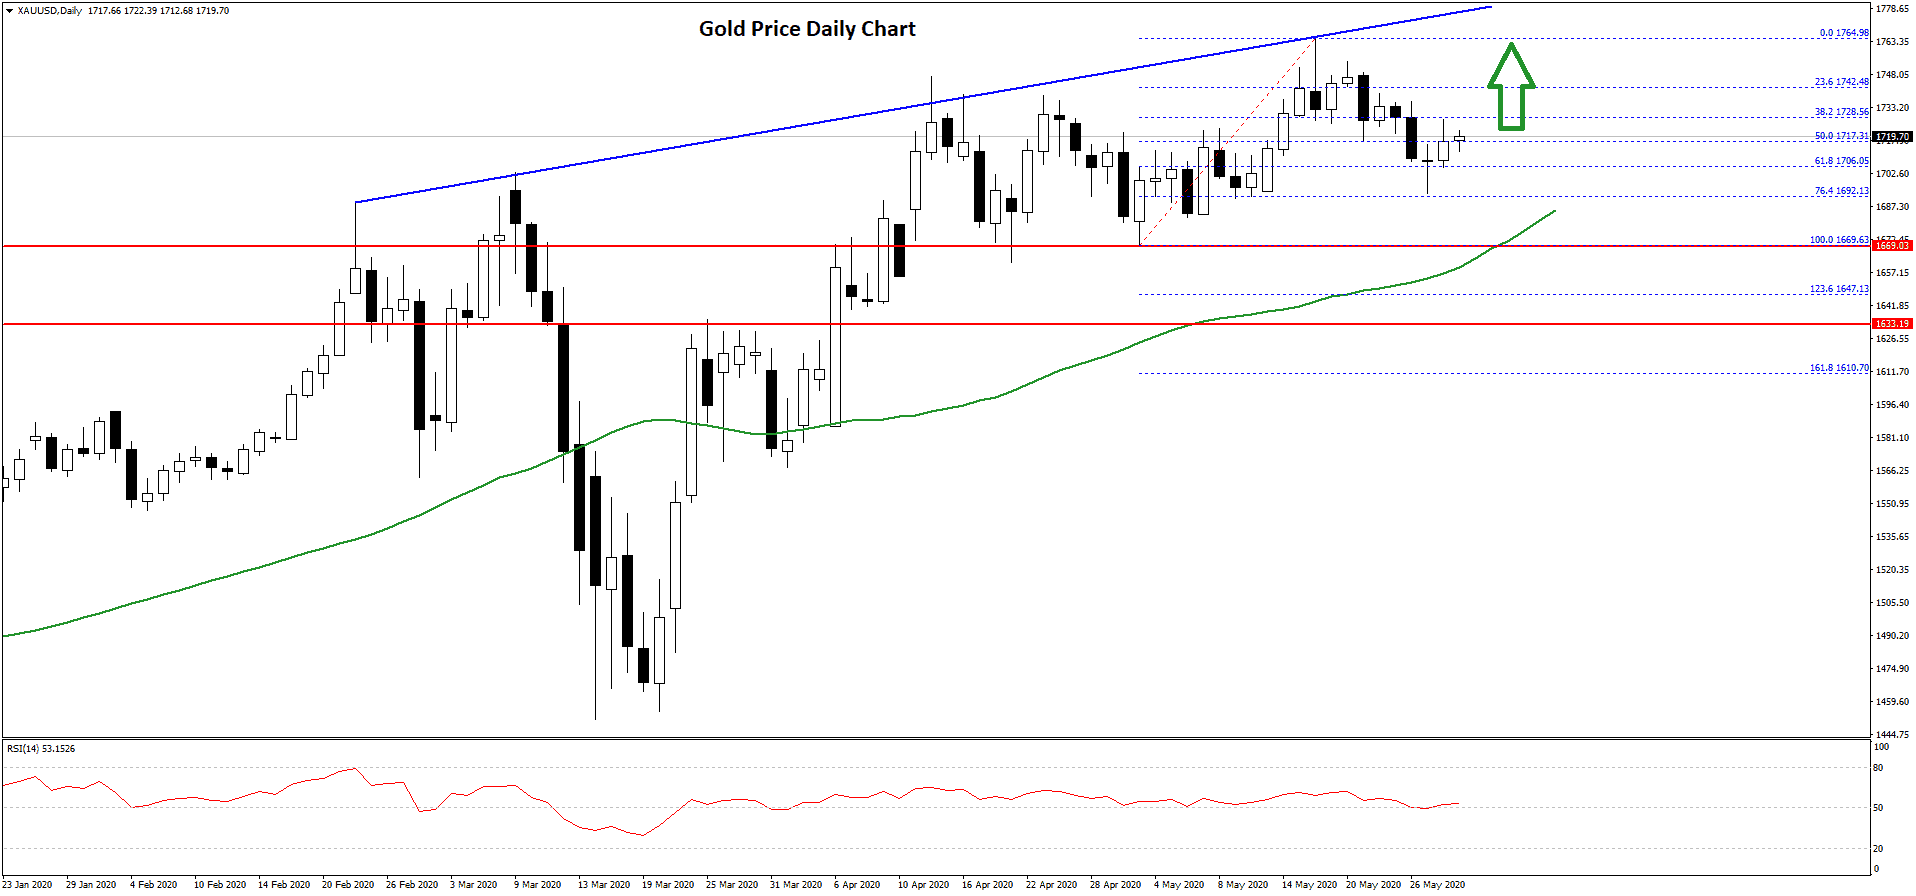
The bears pushed the price below the $1,750 level. It even broke the 50% Fib retracement level of the upward move from the $1,669 low to $1,764 high. However, the decline was protected by the $1,690 level.
It seems like the price found support near the 76.4% Fib retracement level of the upward move from the $1,669 low to $1,764 high. The next major support on the downside is near the $1,685 level and the 50-day simple moving average.
Any further losses may perhaps open the doors for a larger decline towards the $1,650 and $1,640 levels in the near term. On the upside, an initial resistance is near the $1,740 level.
The first major resistance is near the $1,765 level. There is also a key resistance trend line forming with the current hurdle at $1,775 on the daily chart of gold. Any further gains could lead gold price towards the $1,800 level.
Oil Price Technical Analysis
Crude oil price started a strong increase after it settled above the $20.00 level against the US Dollar. The price gained traction and broke the $25.00 and $28.00 resistance levels.
Besides, there was a close above the $30.00 resistance area and the 50-day simple moving average. During the rise, there was a break above a key bearish trend line with resistance near $26.50 on the daily chart of XTI/USD.
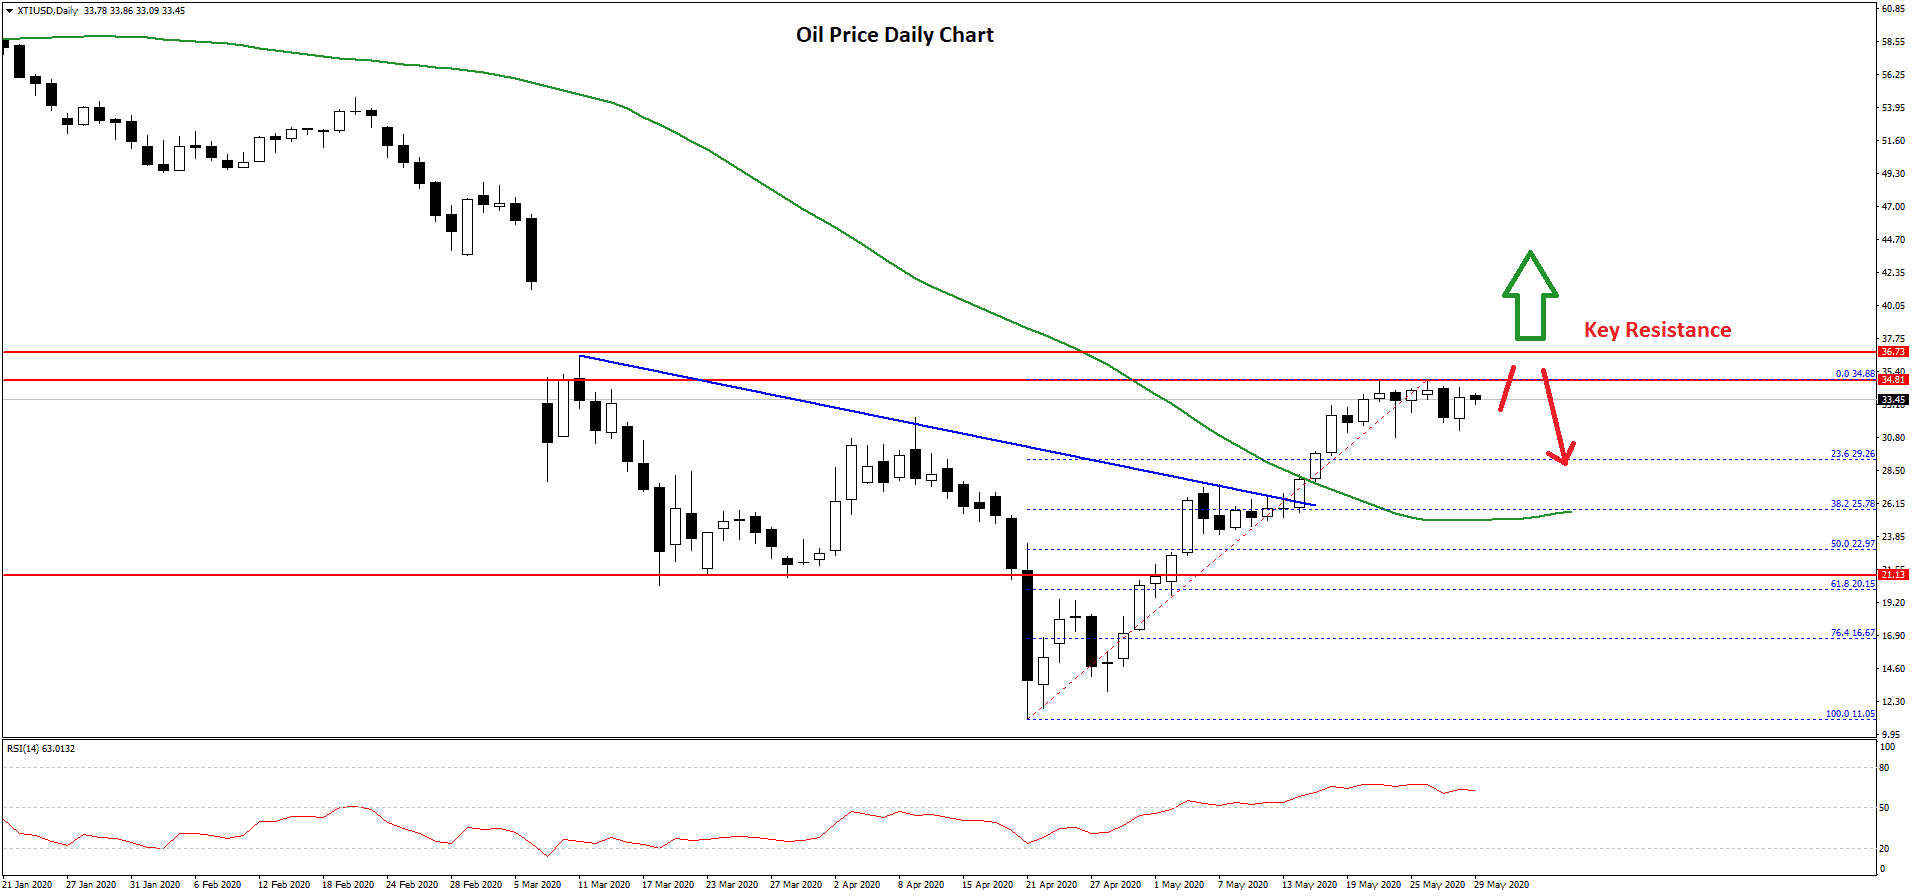
It climbed towards the main $35.00 resistance area, where sellers appeared. It is currently consolidating gains, with an immediate support near the 23.6% Fib retracement level of the upward move from the $11.05 low to $34.88 high.
On the downside, the first key support is seen near the $25.75 level and the 50-day simple moving average. The next major support is near the $23.00 zone since it is close to the 50% Fib retracement level of the upward move from the $11.05 low to $34.88 high.
Overall, there are many supports on the downside, starting with $30.00 and up to $23.00. On the upside, the bulls need to gain traction above the $35.00 resistance for more gains.
The next major resistance on the upside is near the $36.75 level, above which it could test $38.00 in the near term.
Trade over 50 forex markets 24 hours a day with FXOpen. Take advantage of low commissions, deep liquidity, and spreads from 0.0 pips (additional fees may apply). Open your FXOpen account now or learn more about trading forex with FXOpen.
This article represents the opinion of the Companies operating under the FXOpen brand only. It is not to be construed as an offer, solicitation, or recommendation with respect to products and services provided by the Companies operating under the FXOpen brand, nor is it to be considered financial advice.
Stay ahead of the market!
Subscribe now to our mailing list and receive the latest market news and insights delivered directly to your inbox.


Latest articles

EUR/USD Eyes Gains As USD/CHF Weakness Deepens Again
EUR/USD started a fresh increase above 1.1700 and 1.1720. USD/CHF declined further and is now struggling below 0.7835.
Important Takeaways for EUR/USD and USD/CHF Analysis Today
· The Euro started a decent increase from

Apple: Earnings Day Above the Activity Zone
On 30 April, after the market close, Apple Inc. will release its financial results for the second quarter of fiscal 2026. The consensus forecast, based on estimates from 31 analysts, points to revenue of around $109.7 billion, with expected

USD/JPY and USD/CHF Near Key Levels: The Dollar Supported by the Fed
The US dollar continues to trend upwards following the Federal Reserve meeting, drawing support from the regulator’s moderately hawkish stance and comments by Jerome Powell. Markets interpret the Fed’s rhetoric as a signal that restrictive policy is likely