


Gold Price And Crude Oil Price Rally Significantly
FXOpen

Gold price rallied sharply and broke the $1,350 and $1,400 resistance levels. Similarly, crude oil price gained bullish momentum and broke the $55.00 resistance area.
Important Takeaways for Gold and Oil
- Gold price started a solid upward move after it broke the $1,380 resistance against the US Dollar.
- There is a connecting bullish trend line forming with support near $1,395 on the hourly chart of gold.
- Crude oil price traded above the $55.00 and $56.50 resistance levels.
- There is a major bullish trend line forming with support near $56.15 on the hourly chart of XTI/USD.
Gold Price Technical Analysis
Gold price formed a solid support base above $1,350 and recently rallied above $1,380 against the US Dollar. The price gained bullish momentum above $1,390 after the Fed indicated possibilities of a rate cut in the near future.
The recent upward move was strong since the price even broke the $1,400 resistance area and settled above the 50 hourly simple moving average. It climbed towards the $1,415 level and a new monthly high was formed near $1,411 on FXOpen.
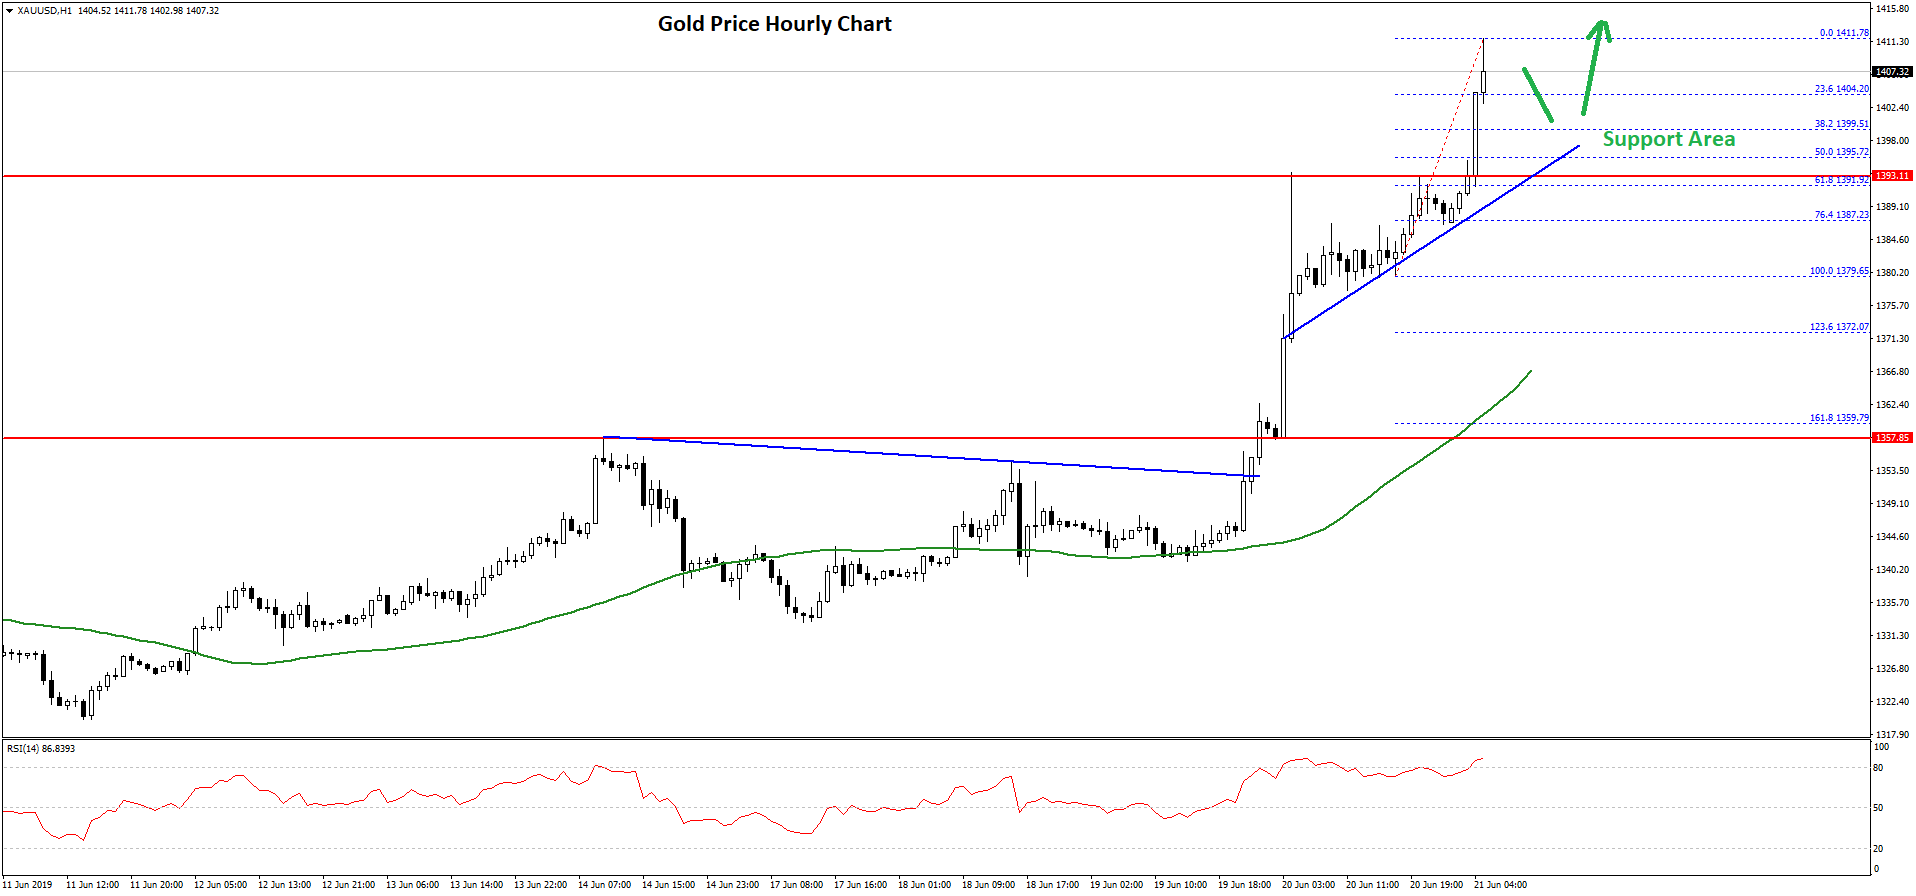
The price is currently correcting lower below $1,410, with an initial support near the 23.6% Fib retracement level of the recent wave from the $1,379 low to $1,411 high.
On the downside, there are many supports near the $1,400 and $1,395 levels. There is also a connecting bullish trend line forming with support near $1,395 on the hourly chart of gold.
The trend line support coincides with the 50% Fib retracement level of the recent wave from the $1,379 low to $1,411 high. Therefore, if the price corrects lower, the $1,395 support area is likely to act as a strong buy zone in the near term.
On the upside, an initial resistance is near the $1,410 level, above which the price could climb above the $1,415 level. The next key resistance for the bulls is near the $1,420 level.
Oil Price Technical Analysis
After forming a support base, crude oil price started a decent upward move above the $54.00 resistance against the US Dollar. The price broke the $55.00 resistance area to move into a positive zone and start an upward move.
As a result, there were gains above the $56.00 and $57.00 levels. The price even traded above the $57.50 level and settled nicely above the 50 hourly simple moving average.
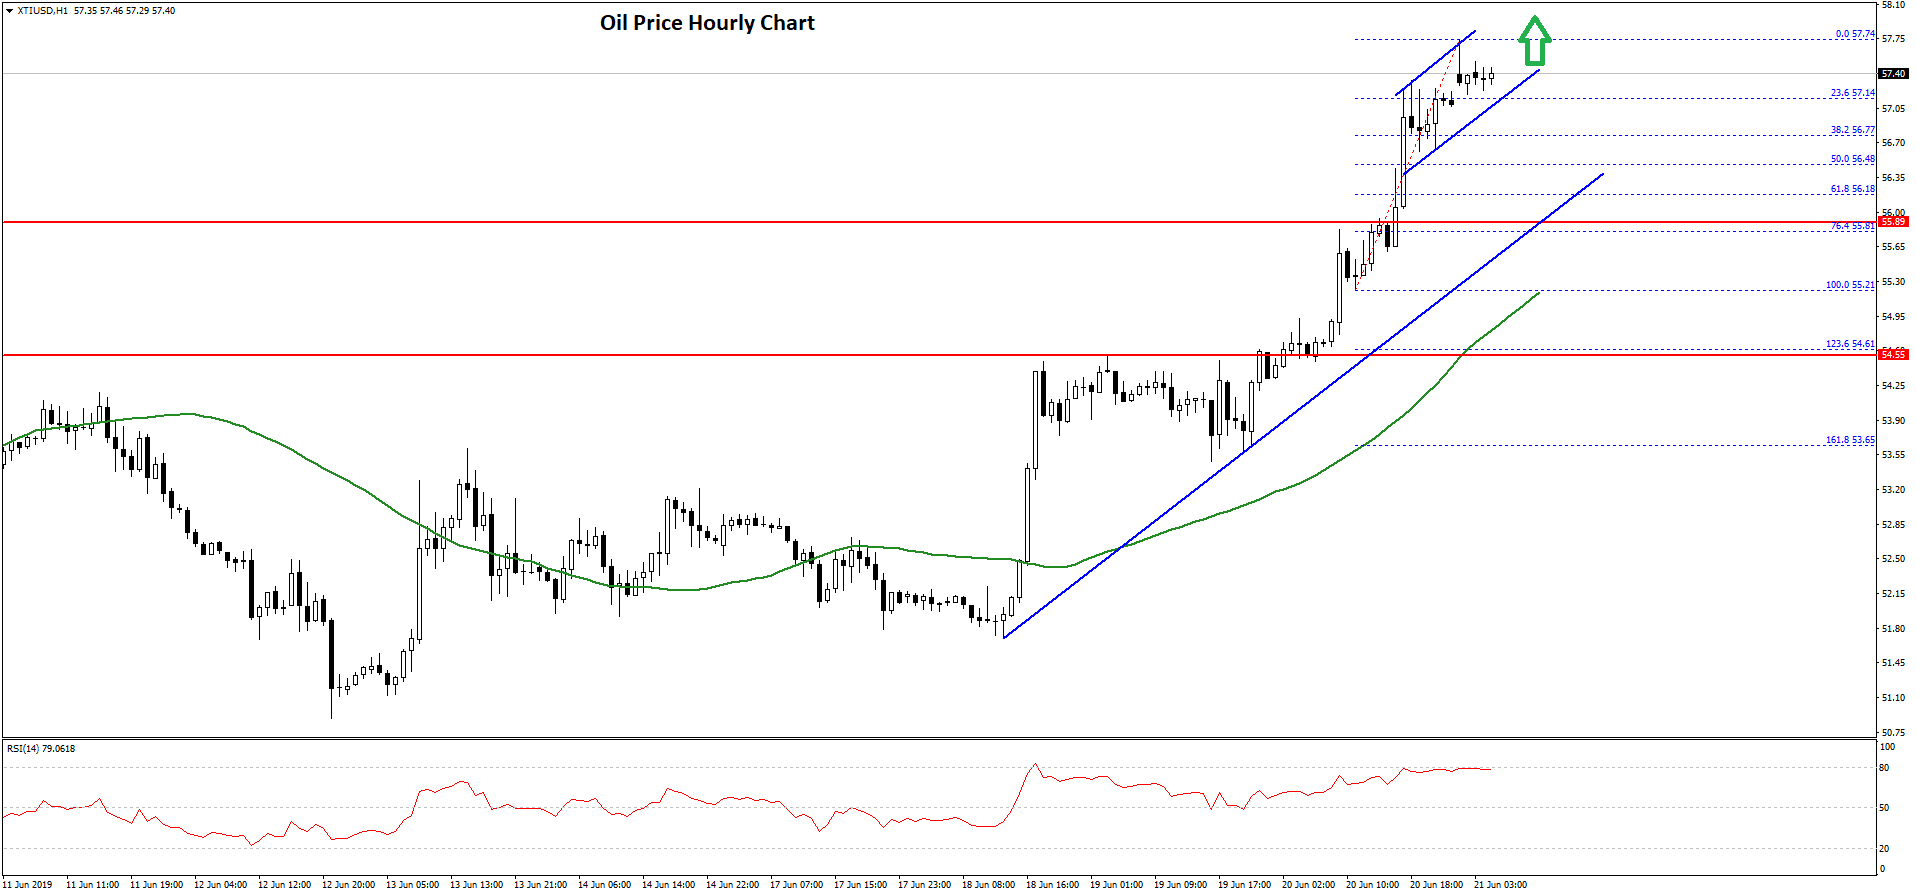
The recent swing high was formed at $57.74 and the price is currently consolidating gains. An initial support is near the $57.15 level and the 23.6% Fib retracement level of the recent wave from the $55.21 low to $57.74 high.
Moreover, there is also a rising channel forming with support near $57.15 on the hourly chart. If there is a downside break below $57.15 and $57.00, the price could correct lower towards the $56.50 support.
The 50% Fib retracement level of the recent wave from the $55.21 low to $57.74 high is also near the $56.50 level to act as a decent support. Besides, there is a major bullish trend line forming with support near $56.15 on the hourly chart of XTI/USD.
Therefore, if there is an extended downside correction, the price is likely to find a lot of buying interest near the $56.50 and $56.20 levels.
Trade over 50 forex markets 24 hours a day with FXOpen. Take advantage of low commissions, deep liquidity, and spreads from 0.0 pips (additional fees may apply). Open your FXOpen account now or learn more about trading forex with FXOpen.
This article represents the opinion of the Companies operating under the FXOpen brand only. It is not to be construed as an offer, solicitation, or recommendation with respect to products and services provided by the Companies operating under the FXOpen brand, nor is it to be considered financial advice.
Stay ahead of the market!
Subscribe now to our mailing list and receive the latest market news and insights delivered directly to your inbox.


Latest articles

Pound at Key Levels: Markets Assess Impact of Political Uncertainty in the UK
The British pound remains under pressure following increased political uncertainty in the United Kingdom triggered by the Prime Minister’s resignation. Investors are assessing potential shifts in the political and economic policy outlook after the head of government stepped down,

Silver: Fed Tightens Its Tone as Price Returns to the Volume Profile Zone
Silver came under pressure following the Federal Reserve’s June meeting, at which policymakers kept interest rates unchanged at 3.50–3.75%. Nine of the 18 committee members still see the possibility of a rate increase this year, reinforcing

Ethereum: Market Assesses the Strength of the Corrective Recovery
Following a period of heightened volatility in early June, investor attention in Ethereum has once again shifted towards institutional demand and the development of the spot ETF market in the United States. The funds launched last year continue to serve