FXOpen

Gold price is forming a new support base above the $1,900 level. Crude oil price is currently rising and eyeing an upside break above the $43.30 resistance.
Important Takeaways for Gold and Oil
- Gold price declined below the $1,950 level, but it found support above $1,900 against the US Dollar.
- There is a key bearish trend line forming with resistance near $1,942 on the hourly chart of gold.
- Crude oil price is currently trading in a positive zone above the $42.40 support zone.
- There is a major declining channel forming with resistance near $43.30 on the hourly chart of XTI/USD.
Gold Price Technical Analysis
Gold price started a bearish wave below the $2,000 level against the US Dollar. The price broke the $1,950 support level to move into a short-term bearish zone.
The price even traded below the $1,920 level, but it found support above $1,900. The recent low is formed near $1,909 on FXOpen and the price is currently correcting higher.
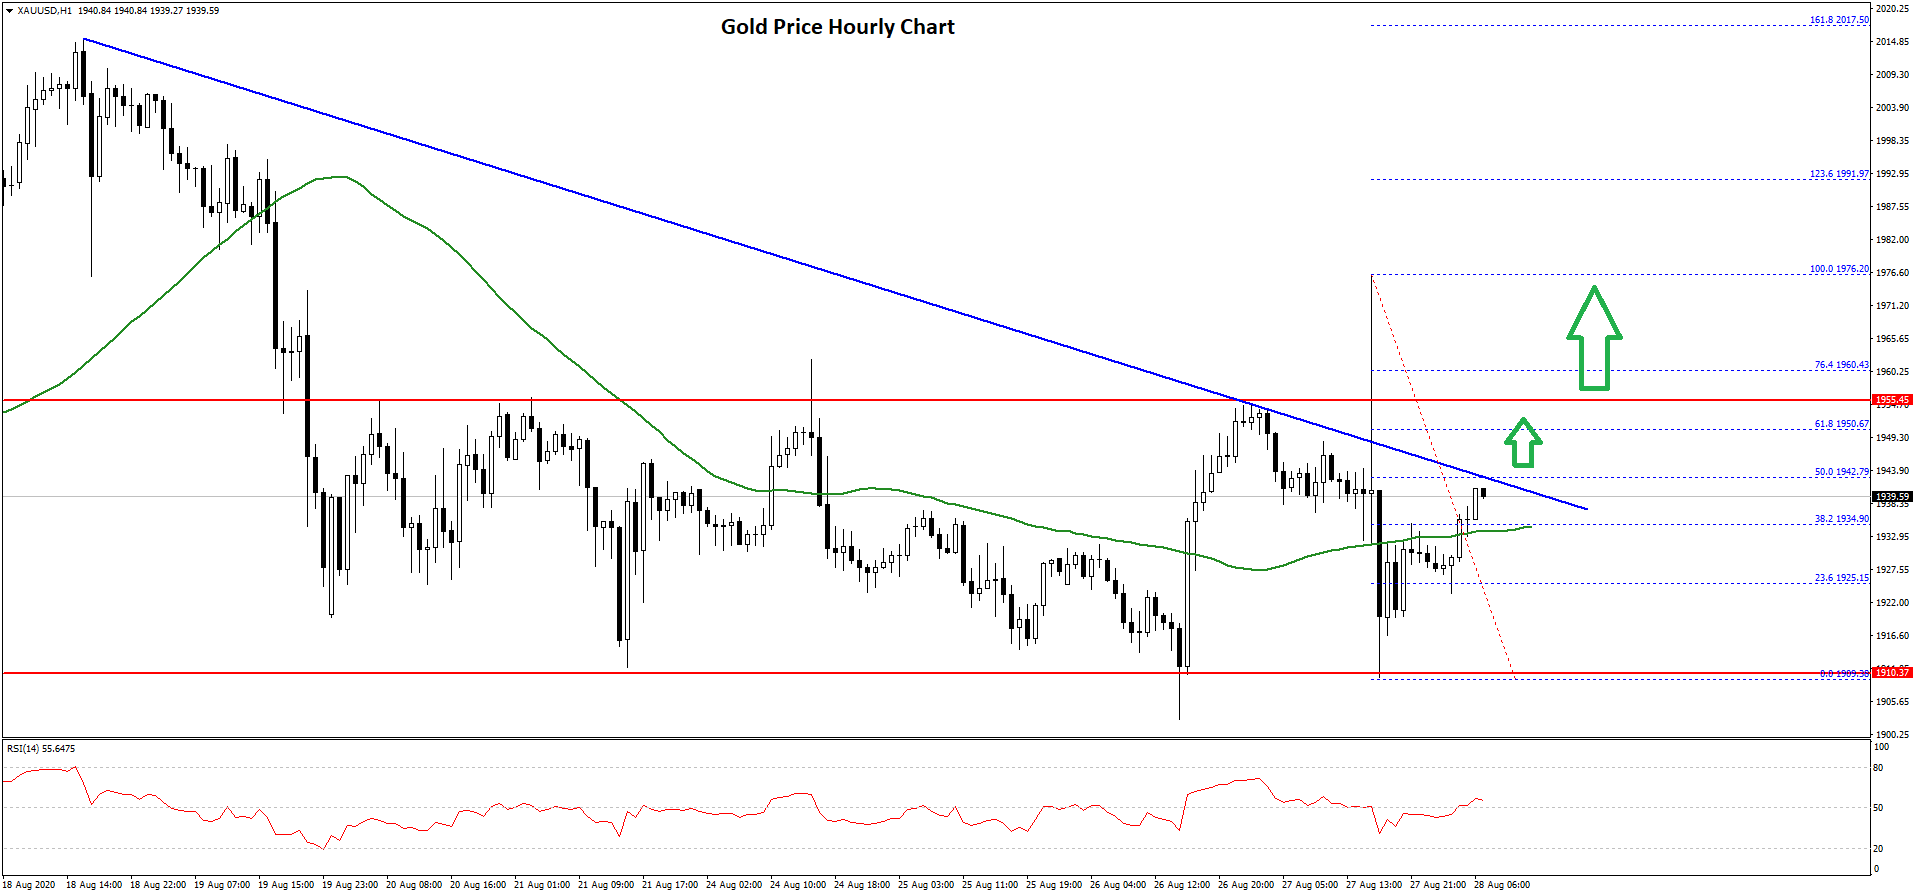
It broke the $1,920 and $1,930 resistance levels. There was also a break above the 38.2% Fib retracement level of the recent decline from the $1,976 high to $1,909 low, and the 50 hourly simple moving average.
On the upside, the price is facing a major resistance near $1,940 and $1,950. There is also a key bearish trend line forming with resistance near $1,942 on the hourly chart of gold.
The trend line coincides with the 50% Fib retracement level of the recent decline from the $1,976 high to $1,909 low. If there is a clear break above the $1,940 and $1,950 resistance levels, the price could continue to rise.
The next major resistance is near $1,975, followed by $1,980. Conversely, the price might fail to surpass the $1,950 resistance. An initial support on the downside is near the $1,935 level and the 50 hourly SMA.
The next major support is near the $1,920 level, below which the price might struggle to stay above the $1,900 support zone in the coming sessions.
Oil Price Technical Analysis
Crude oil price started a fresh increase above the $41.20 and $41.50 resistance levels against the US Dollar. The price even broke the $42.40 resistance zone to move into a positive zone.
It traded as high as $43.84 and recently declined sharply below $43.00. There was also a break below the $42.80 level and the 50 hourly simple moving average. It traded as low as $42.46 and currently correcting higher.
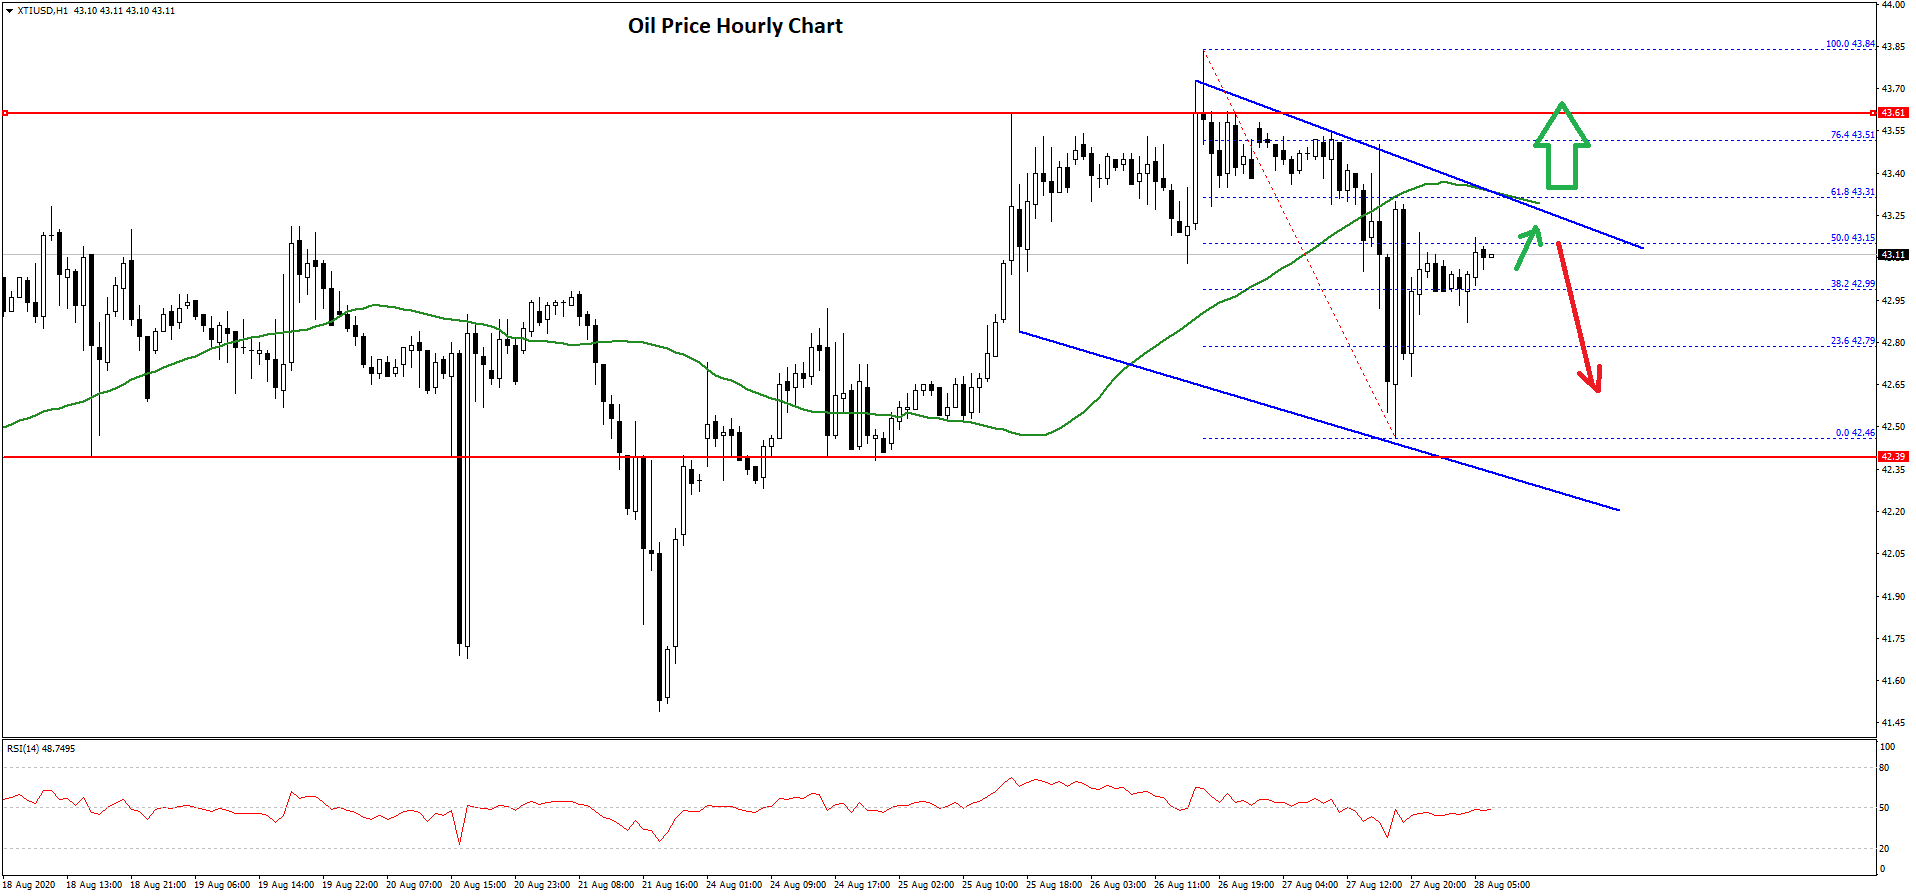
There was a break above the $42.80 level, and the 38.2% Fib retracement level of the recent decline from the $43.84 high to $42.46 low. The price is now facing hurdles near the $43.15 and $43.20 levels.
There is also a major declining channel forming with resistance near $43.30 on the hourly chart of XTI/USD. The channel resistance is close to the 50% Fib retracement level of the recent decline from the $43.84 high to $42.46 low.
Therefore, a clear break above the trend line resistance is needed for a decent increase above the $43.50 level. Conversely, oil price might start a fresh decline below the $43.00 level. The main support on the downside is near $42.40, below which the price might even break $42.00.
Trade over 50 forex markets 24 hours a day with FXOpen. Take advantage of low commissions, deep liquidity, and spreads from 0.0 pips (additional fees may apply). Open your FXOpen account now or learn more about trading forex with FXOpen.
This article represents the opinion of the Companies operating under the FXOpen brand only. It is not to be construed as an offer, solicitation, or recommendation with respect to products and services provided by the Companies operating under the FXOpen brand, nor is it to be considered financial advice.
Stay ahead of the market!
Subscribe now to our mailing list and receive the latest market news and insights delivered directly to your inbox.


Latest articles

Natural Gas Prices Rise Amid Middle East Conflict
The recent strike by Israel and the US, along with Iran’s retaliatory actions, has pushed energy asset prices higher. Yesterday, we reported on a bullish gap in oil markets, and while US natural gas prices have not surged as

The US Dollar Index (DXY) Climbs to a One-and-a-Half-Month High
Today, the US Dollar Index rose above the 98.70 level for the first time since the third week of January. Monday’s trading opened with a bullish gap, and upward momentum continues to build as news emerges of a