


Gold Price and Oil Price Signaling More Upsides
FXOpen

Gold price started a fresh increase from the $1,870 support and climbed above $1,900. Crude oil price is currently rising and trading well above the $40.00 pivot level.
Important Takeaways for Gold and Oil
- Gold price started a strong upward move above the $1,880 and $1,900 levels against the US Dollar.
- There was a break above a key rising channel with resistance near $1,902 on the hourly chart of gold.
- Crude oil price climbed higher steadily after it broke the $38.80 and $40.00 resistance levels.
- There is a major bullish trend line forming with support near $41.00 on the hourly chart of XTI/USD.
Gold Price Technical Analysis
Gold price remained well bid above the $1,870 support level and started a fresh increase against the US Dollar. The price broke the $1,885 and $1,890 resistance levels to move into a positive zone.
There was a proper close above the $1,900 resistance level and the 50 hourly simple moving average. During the rise, there was a break above a key rising channel with resistance near $1,902 on the hourly chart of gold.
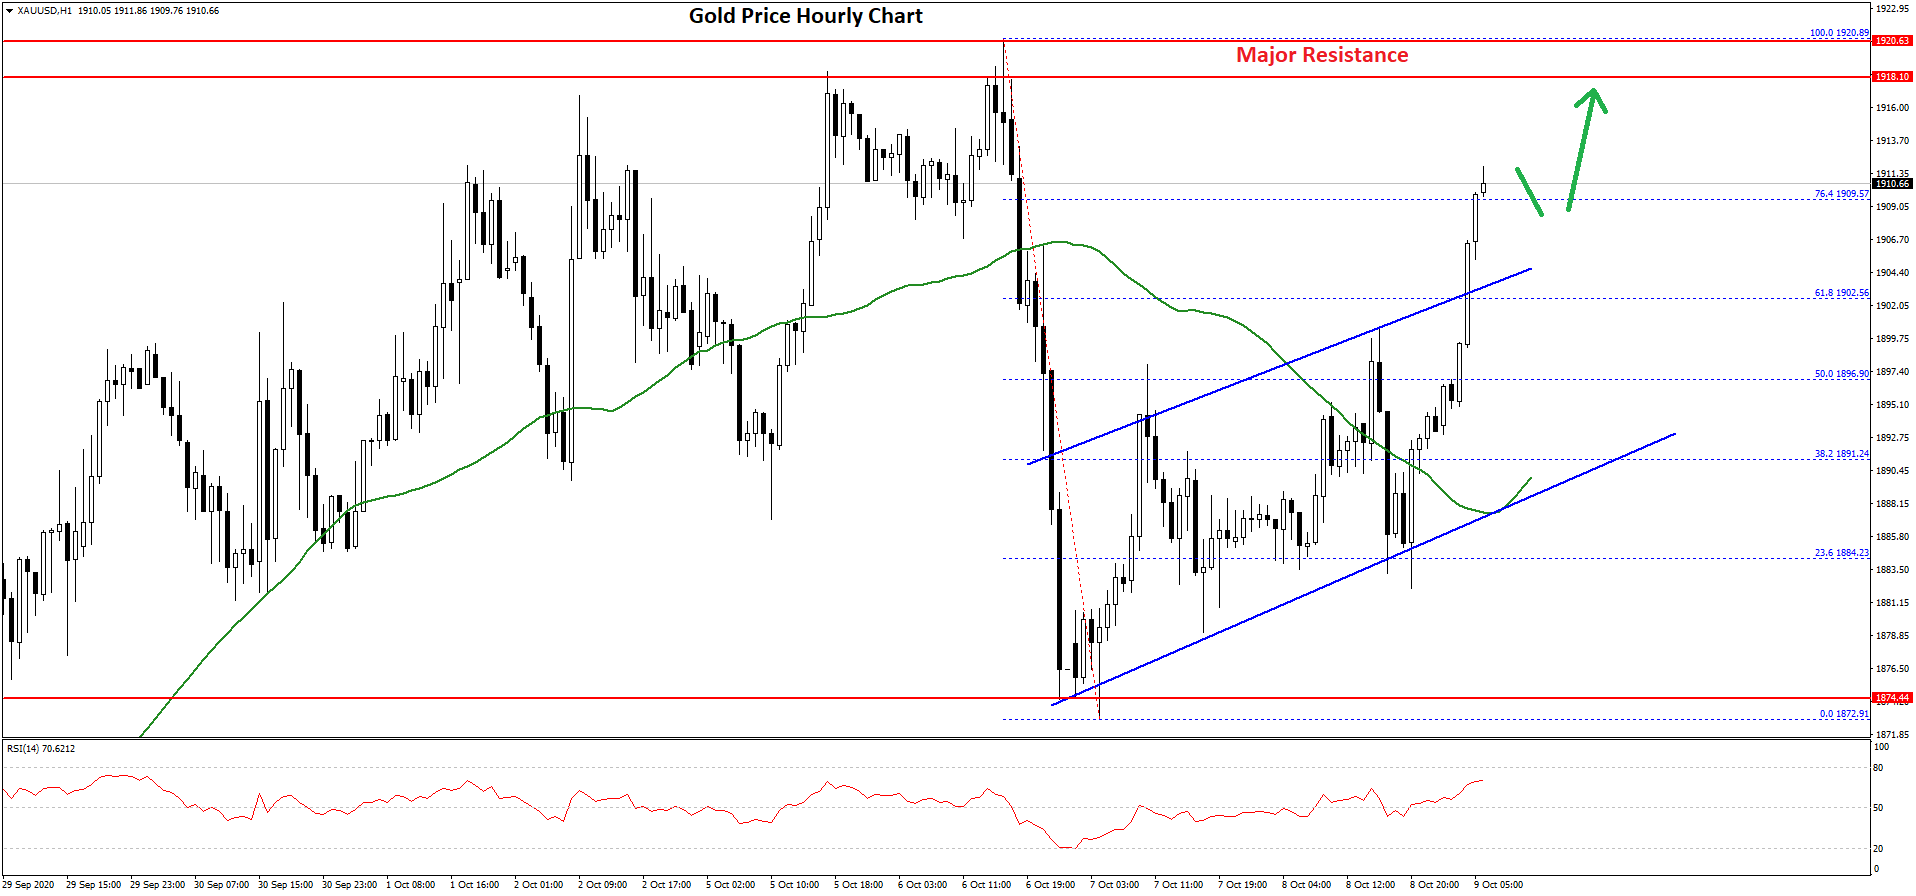
Besides, the price surpassed the 50% Fib retracement level of the key decline from the $1,920 high (formed on FXOpen) to $1,872 low. The bulls are clearly in control above $1,905, with positive signs.
The price is trading above the 76.4% Fib retracement level of the key decline from the $1,920 high to $1,872 low. Therefore, there are chances of more upsides towards the $1,920 high in the coming sessions. Any further gains could open the doors for a larger increase towards the $1,945 and $1,950 levels.
If there is a downside correction, the price might find support near the $1,905 level or the broken channel trend line. The next major support is near the $1,900 level, below which the price might retest the 50 hourly simple moving average at $1,890.
Oil Price Technical Analysis
Crude oil price remained well bid and it broke many hurdles near the $38.80 resistance against the US Dollar. The price even broke the $40.00 resistance level to move further into a bullish zone.
The price traded to a new weekly high at $41.67 and it is currently correcting gains. An initial support is near the $41.15 level. It is close to the 23.6% Fib retracement level of the upward move from the $39.46 swing low to $41.67 high.
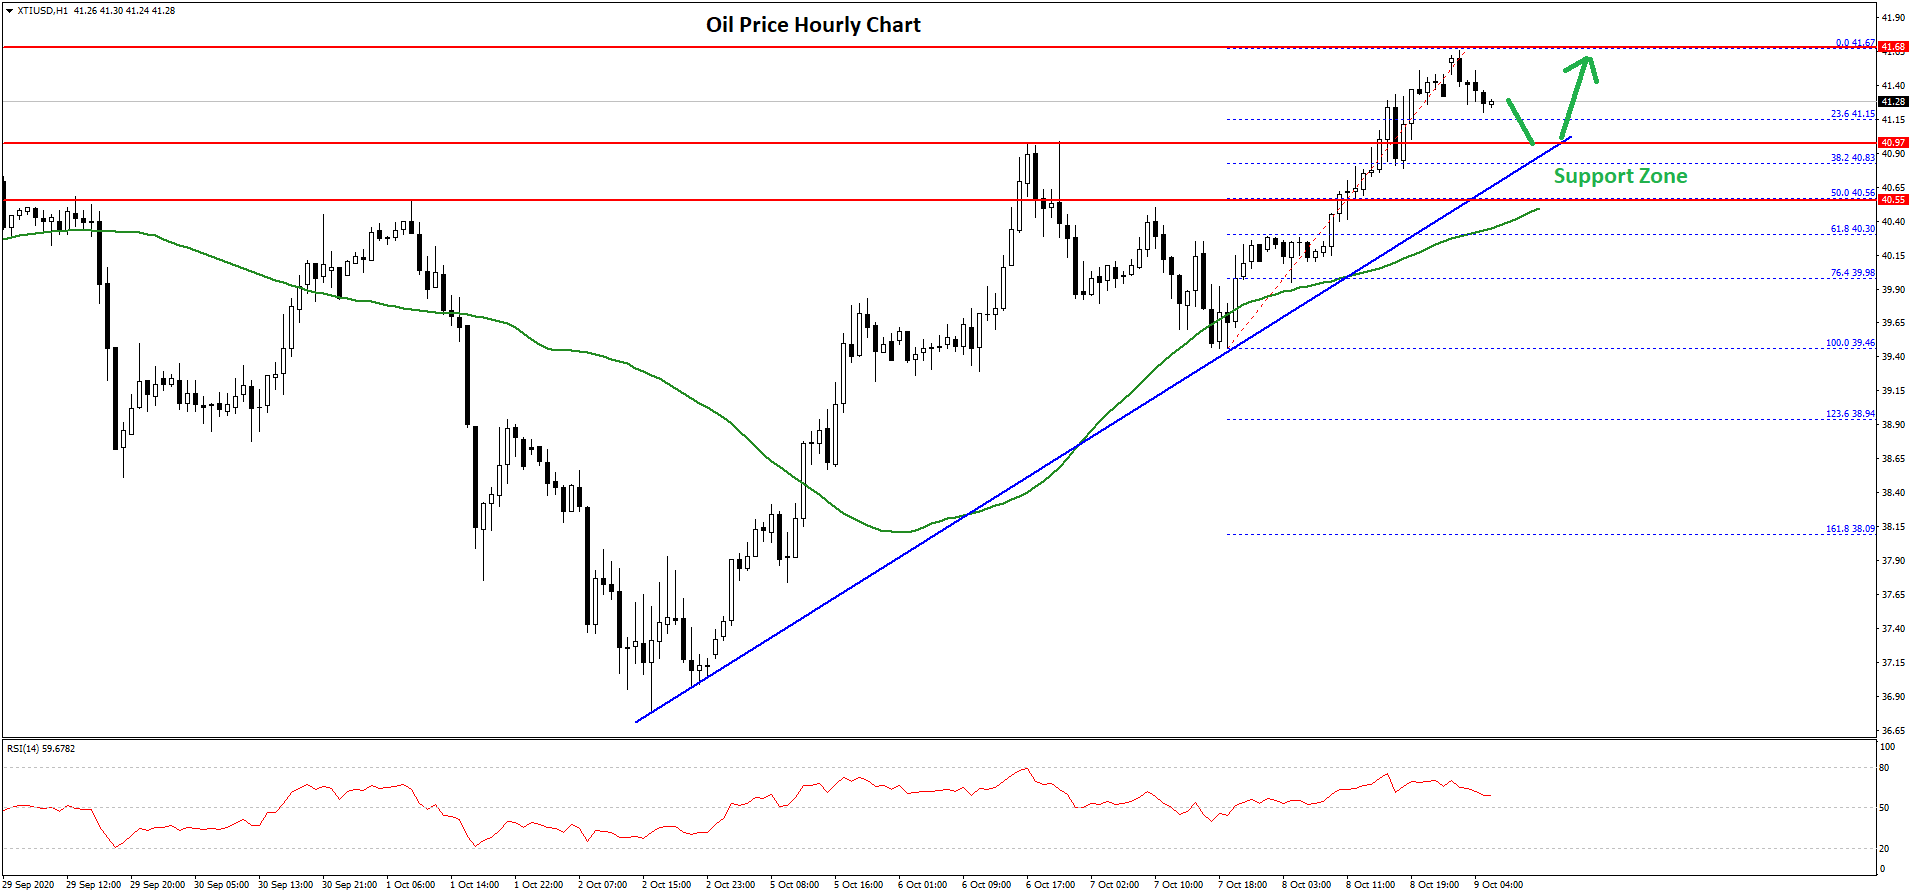
There is also a major bullish trend line forming with support near $41.00 on the hourly chart of XTI/USD. The next major support is near the $40.55 level or the 50% Fib retracement level of the upward move from the $39.46 swing low to $41.67 high.
The 50 hourly simple moving average is also near the $40.50 level to provide support, below which the price might test the main $40.00 support level. Any further losses might start a larger decline towards $38.00.
On the upside, an initial resistance is near the $41.65 level. A clear break above the $41.65 and $41.80 levels might open the doors for more gains.
The main resistance is near the $42.00 level, above which the bulls are likely to aim a test of the $43.50 level in the coming sessions. An intermediate resistance could be near the $42.80 level.
Trade over 50 forex markets 24 hours a day with FXOpen. Take advantage of low commissions, deep liquidity, and spreads from 0.0 pips (additional fees may apply). Open your FXOpen account now or learn more about trading forex with FXOpen.
This article represents the opinion of the Companies operating under the FXOpen brand only. It is not to be construed as an offer, solicitation, or recommendation with respect to products and services provided by the Companies operating under the FXOpen brand, nor is it to be considered financial advice.
Stay ahead of the market!
Subscribe now to our mailing list and receive the latest market news and insights delivered directly to your inbox.


Latest articles

DAX 40: consolidation amid technology sell-off
A wave of selling in the technology sector that emerged earlier this week has weighed on European equities. The trigger was investor concern over the profitability of large-scale debt-funded investments by major US tech companies in AI infrastructure. The Nasdaq

Euro Hits Fresh Yearly Lows Amid Dovish ECB Signals
The euro remains under pressure following weak macroeconomic data from the euro area and fresh signals that the European Central Bank is prepared to maintain a more accommodative monetary policy stance. Data released yesterday pointed to a deterioration in business

Pound at Key Levels: Markets Assess Impact of Political Uncertainty in the UK
The British pound remains under pressure following increased political uncertainty in the United Kingdom triggered by the Prime Minister’s resignation. Investors are assessing potential shifts in the political and economic policy outlook after the head of government stepped down,