


Gold Price Broke Key Support While Oil Price Continues to Rise
FXOpen
Gold price faced a strong resistance near $1,235 and declined sharply. However, Crude oil price remains in an uptrend and it looks set for more gains above $70.00.
Important Takeaways for Gold and Oil
- Gold price likely formed a double top pattern near the $1,265 level against the US Dollar.
- There was a break below a key bullish trend line with support at $1,226 on the hourly chart of gold.
- Crude oil price is following a crucial ascending channel with support at $68.80 on the hourly chart.
- The US Durable Goods Orders in June 2018 increased 1%, less than the forecast of +3.0%.
Gold Price Technical Analysis
Gold price climbed higher this week above the $1,230 level against the US Dollar. However, the price faced a major resistance near the $1,235 level, which prevented further upsides.
There were two rejections noted around the $1,235 resistance, resulting in a downside move. There was a sharp decline and the price broke the $1,228 support. Moreover, there was a break below a key bullish trend line with support at $1,226 on the hourly chart.
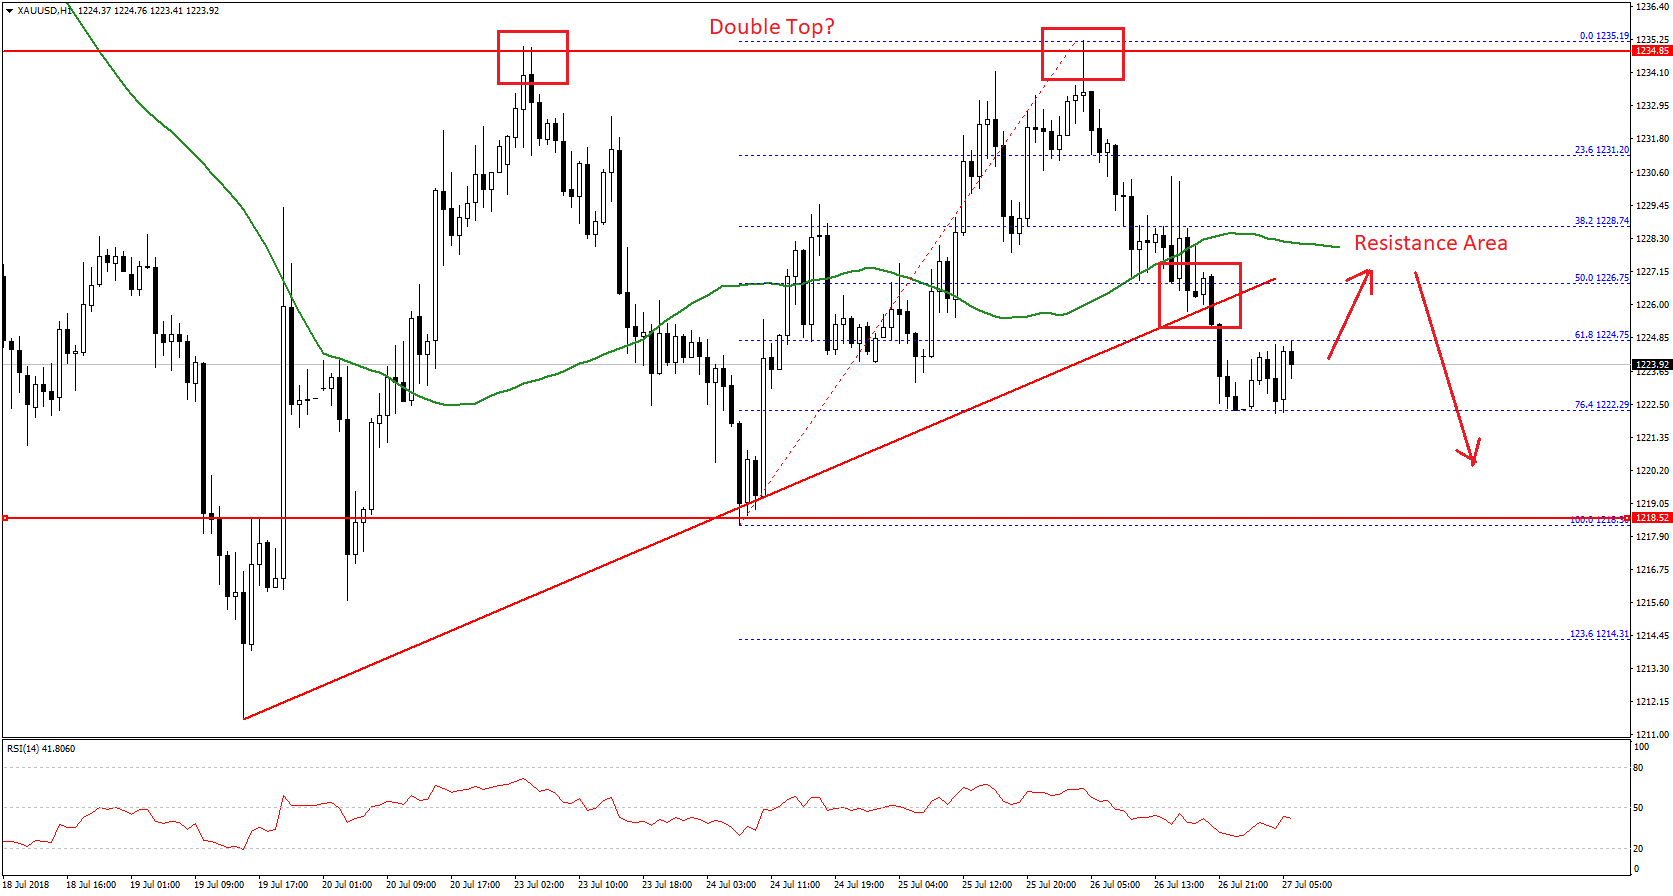
The price even broke the 50% Fib retracement level of the last wave from the $1,218 low to $1,235 high. It seems like the price formed a double top pattern near the $1,265 level. At present, it is holding the 76.4% Fib retracement level of the last wave from the $1,218 low to $1,235 high at $1,222.
Should there be a downside break below $1,222, the price may perhaps decline further towards the $1,218 low. Below this, there are chances of acceleration towards the $1,210 level in the near term.
On the other hand, if the price corrects higher, the previous support near $1,228 and the 50 hourly simple moving average are likely to act as resistances. Above this, the double top resistance near $1,235 could once again prevent gains.
Oil Price Technical Analysis
Crude oil price started a major uptrend from the $66.00 support zone against the US Dollar. The price traded higher and broke the $66.50, $67.00 and $68.00 resistance levels.
The price is accelerating higher and is currently trading well above the $68.50 level and the 50 hourly simple moving average. More importantly, there is a crucial ascending channel formed with support at $68.80 on the hourly chart.
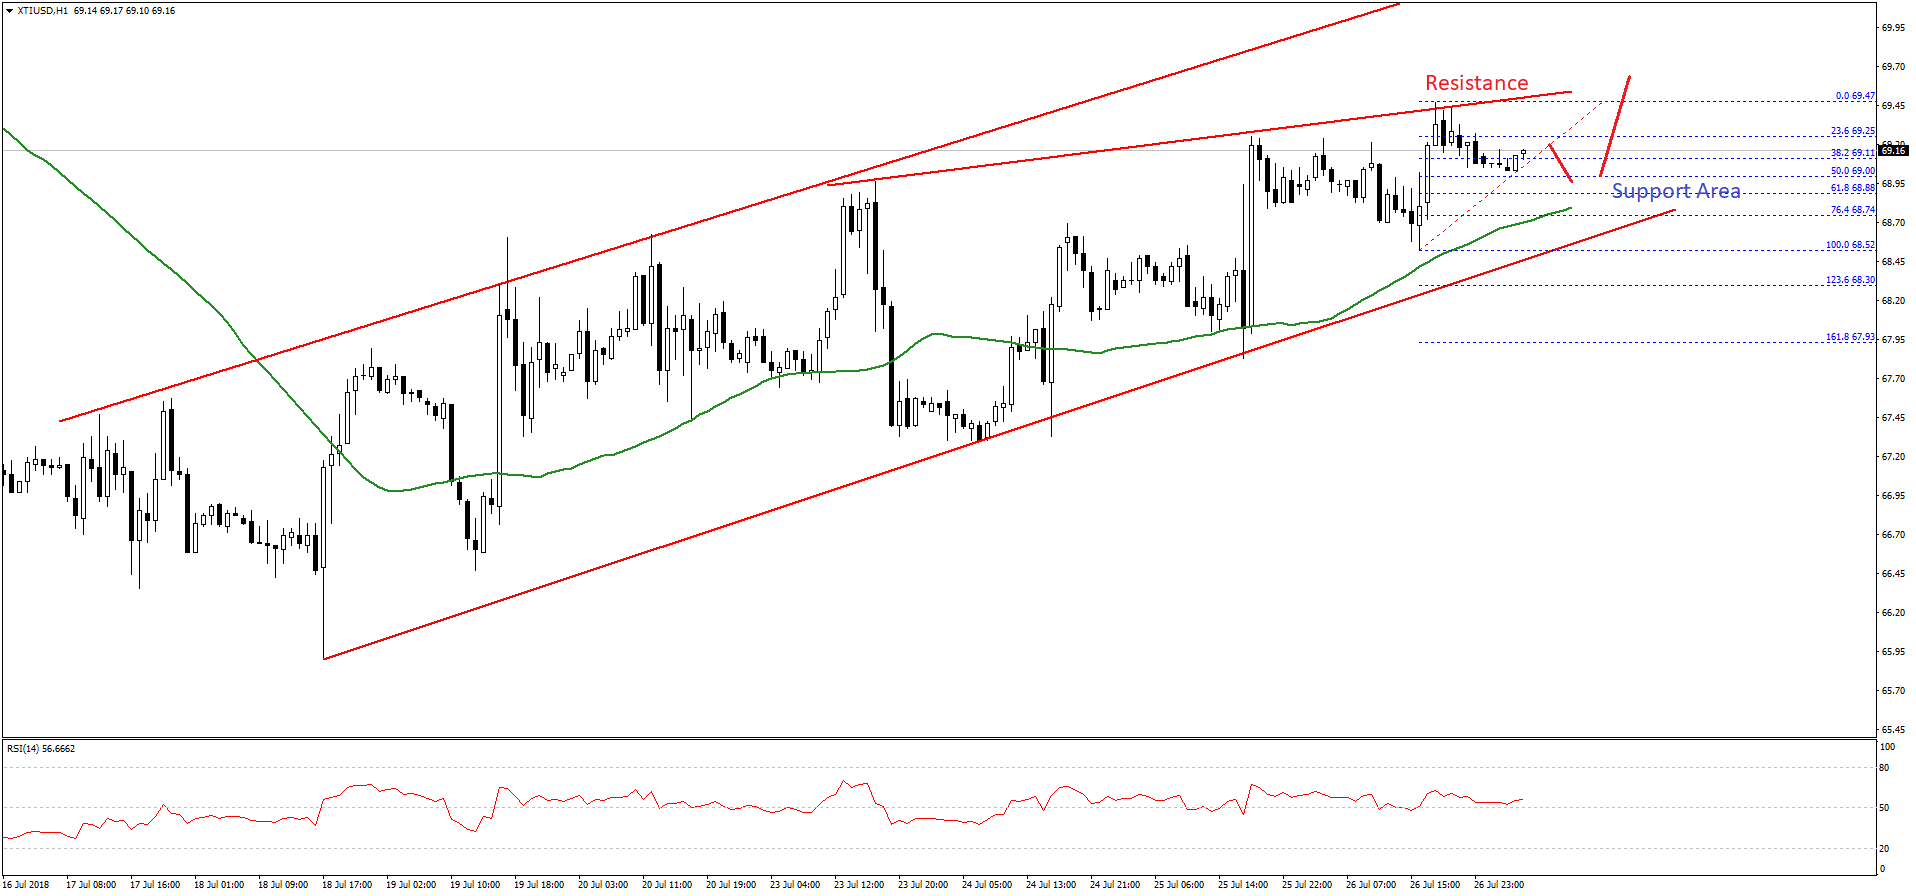
The price recently traded as high as $69.47 where it faced a connecting resistance trend line. It corrected lower and tested the 50% Fib retracement level of the last wave from the $68.52 low to $69.47 high.
On the downside, there are many supports around the $68.80 level. The 50 hourly SMA is positioned near the channel support at $68.80 to act as a strong buy zone. Therefore, if the price dips towards $68.80, it is likely to find buyers.
Should there be a break below $68.80, the price may perhaps decline further towards $68.00. To the topside, a break above the trend line resistance at $69.50 could open the doors for a push above the $70.00 level in the near term.
Recently in the US, the Durable Goods Orders report for June 2018 was released. The market was looking for a rise of 3% in the Durable Goods Orders, but the actual result was disappointing as there was a 1% rise in orders.
Trade over 50 forex markets 24 hours a day with FXOpen. Take advantage of low commissions, deep liquidity, and spreads from 0.0 pips (additional fees may apply). Open your FXOpen account now or learn more about trading forex with FXOpen.
This article represents the opinion of the Companies operating under the FXOpen brand only. It is not to be construed as an offer, solicitation, or recommendation with respect to products and services provided by the Companies operating under the FXOpen brand, nor is it to be considered financial advice.
Stay ahead of the market!
Subscribe now to our mailing list and receive the latest market news and insights delivered directly to your inbox.


Latest articles

Weekly Market Insights with Gary Thomson: The Week of Central Banks and Earnings
In this video, we’ll explore the key economic events and market trends, shaping the financial landscape. Get ready for insights into financial markets to help you navigate the week ahead. Let’s dive in!
In this episode of Market

Intel at a Crossroads: Earnings Beat Meets Technical Resistance
Intel has just delivered its strongest quarter in over fifteen years, and the market reaction says it all. Q2 2026 revenue surged 25% year-over-year to $16.1 billion, crushing the consensus estimate of $14.42 billion, while adjusted EPS of

Tesla: Complex Range Structure Breaks Down Following Quarterly Earnings
Tesla released its Q2 2026 results after the market closed on 22 July. Revenue increased 26% year-on-year to $28.24 billion, while vehicle deliveries reached a record 480,126 units. However, operating margin fell sharply to 1.4%, down from