FXOpen

Gold price declined heavily below $1,850 and tested the $1,800 support zone. Conversely, crude oil price gained bullish momentum above $42.00 and it even traded to a new multi-month high.
Important Takeaways for Gold and Oil
- Gold price declined below the $1,850 and $1,835 support levels against the US Dollar.
- There is a key contracting triangle forming with resistance near $1,812 on the hourly chart of gold.
- Crude oil price is currently correcting gains after trading close to the $46.50 level.
- There is a major contracting triangle forming with resistance near $45.35 on the hourly chart of XTI/USD.
Gold Price Technical Analysis
Gold price started a fresh decline after trading as high as $1,879 against the US Dollar. The price broke the $1,850 and $1,835 support levels to move into a bearish zone.
The price even broke the $1,825 support level and settled well below the 50 hourly simple moving average. It traded as low as $1,850 on FXOpen and recently started consolidating losses.
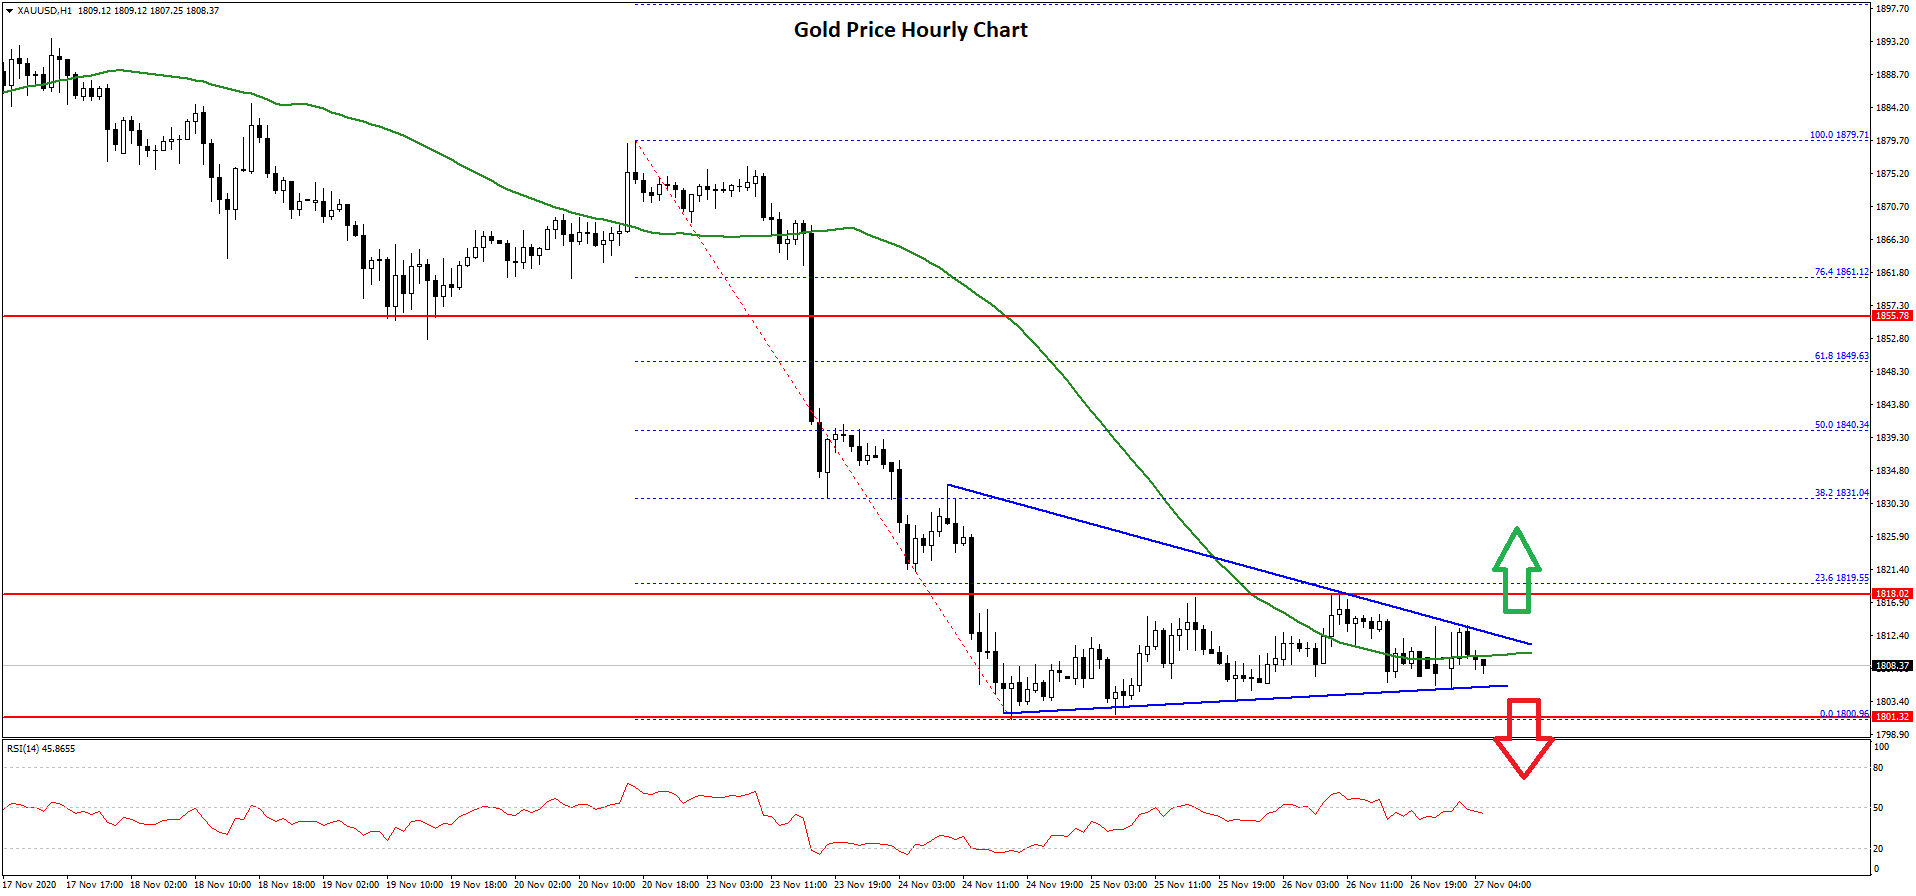
There was no major upward move and the price remained well below the 23.6% Fib retracement level of the recent drop from the $1,879 swing high to $1,800 low. Moreover, there is a key contracting triangle forming with resistance near $1,812 on the hourly chart of gold.
If there is an upside break above the triangle resistance, the price could recover above the $1,820 level. The next major resistance is near the $1,840 level.
The 50% Fib retracement level of the recent drop from the $1,879 swing high to $1,800 low is positioned near the $1,840 level to act as a major hurdle for the bulls. If there are more gains, the price could test the $1,865 resistance.
Conversely, the price could start a fresh decline below the $1,805 and $1,800 support levels. The next major support is near $1,785, below which there is a risk of a sharp decline towards $1,760. Any further losses could lead the price towards the $1,750 support level in the coming sessions.
Oil Price Technical Analysis
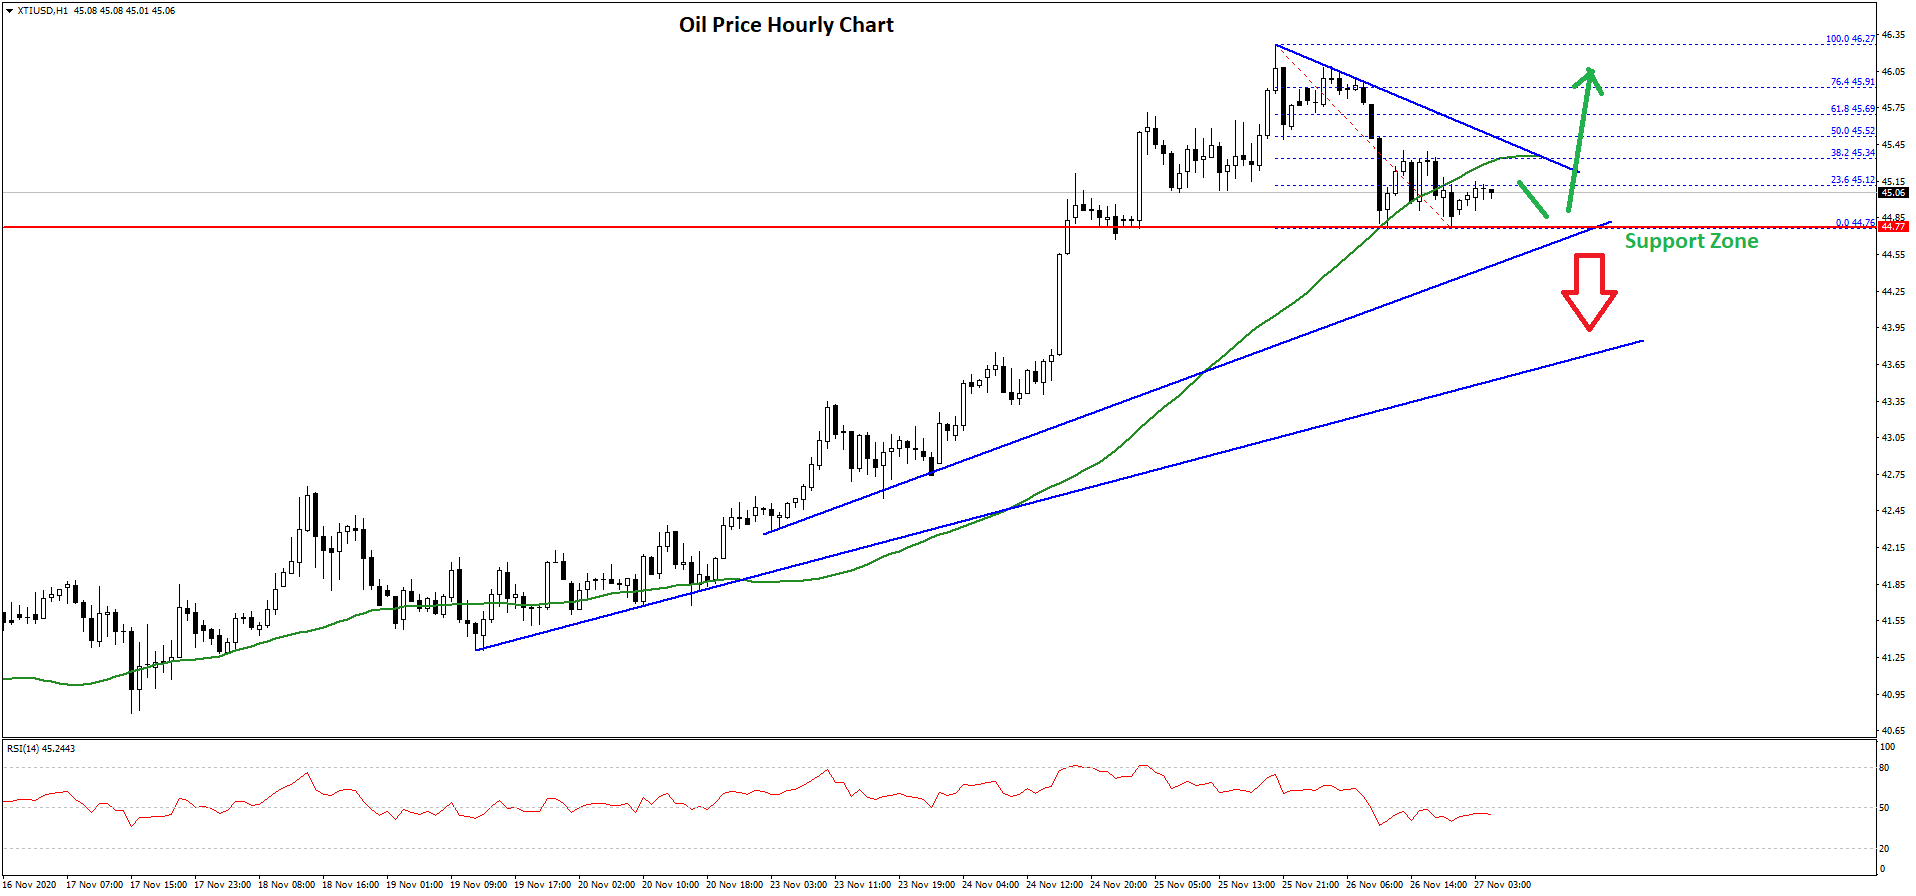
Crude oil price started a strong increase from the $40.00 support zone against the US Dollar. The price broke many hurdles near $42.00 and $43.50 to move further into a positive zone.
There was a steady rise above the $45.00 level and the 50 hourly simple moving average. The price even spiked above the $46.00 level and traded to a new 8-month high at $46.27. Recently, there was a downside correction below the $46.00 level.
 gold
gold
There was a break below the $45.50 level, but the price found support near $45.00. A low is formed near $44.76 and the price is currently trading in a range. An initial resistance is near the $45.10 level.
The 23.6% Fib retracement level of the recent decline from the $46.27 high to $44.76 low is also near $45.12. There is also a major contracting triangle forming with resistance near $45.35 on the hourly chart of XTI/USD.
The 50% Fib retracement level of the recent decline from the $46.27 high to $44.76 low sits at $45.52. Therefore, a clear break above the triangle resistance and then $45.50 could open the doors for a larger increase in the coming sessions.
The first major resistance is near the $46.00 level, above which it could even surpass $46.50. On the downside, there is a key support forming near the $45.00 zone. A break below the triangle support could lead the price towards the $44.00 support.
Trade over 50 forex markets 24 hours a day with FXOpen. Take advantage of low commissions, deep liquidity, and spreads from 0.0 pips (additional fees may apply). Open your FXOpen account now or learn more about trading forex with FXOpen.
This article represents the opinion of the Companies operating under the FXOpen brand only. It is not to be construed as an offer, solicitation, or recommendation with respect to products and services provided by the Companies operating under the FXOpen brand, nor is it to be considered financial advice.
Stay ahead of the market!
Subscribe now to our mailing list and receive the latest market news and insights delivered directly to your inbox.


Latest articles

XTI/USD Chart Analysis: WTI Oil Price Fluctuates Near $100
For the third Monday in a row, trading in the oil market has opened with a bullish gap, although this time it is not as wide as the gap seen, for example, on 9 March. The reason for the volatility

Gold Price Falls to a Monthly Low
As the XAU/USD chart shows, gold prices today dropped below the 3 March low, reaching levels last seen in the third week of February.
Why Is Gold Declining Despite the War?
Geopolitical turmoil typically supports demand for gold as