


FXOpen
Gold price failed to break the $1,302 and $1,304 resistances, and recently declined below $1,292. Crude oil price is gaining momentum and it could trade above the $63.80 resistance.
Important Takeaways for Gold and Oil
- Gold price failed to stay above the $1,300 pivot level and declined heavily against the US Dollar.
- There is a crucial bullish trend line formed with support at $1,284 on the hourly chart of gold.
- Crude oil price climbed higher and broke the $62.40 and $63.00 resistance levels.
- There is a bullish trend line in place with support near $63.02 on the hourly chart of XTI/USD.
Gold Price Technical Analysis
Gold price started a decent recovery earlier this week from the $1,280 and $1,282 support levels against the US Dollar. The price surged above the $1,290 resistance level and climbed above the $1,300 level.
The price traded as high as $1,303 on FXOpen and later declined. It seems like the price struggled to stay above the $1,300 and $1,302 levels. As a result, there was a sharp decline below the $1,295 and $1,290 support levels.
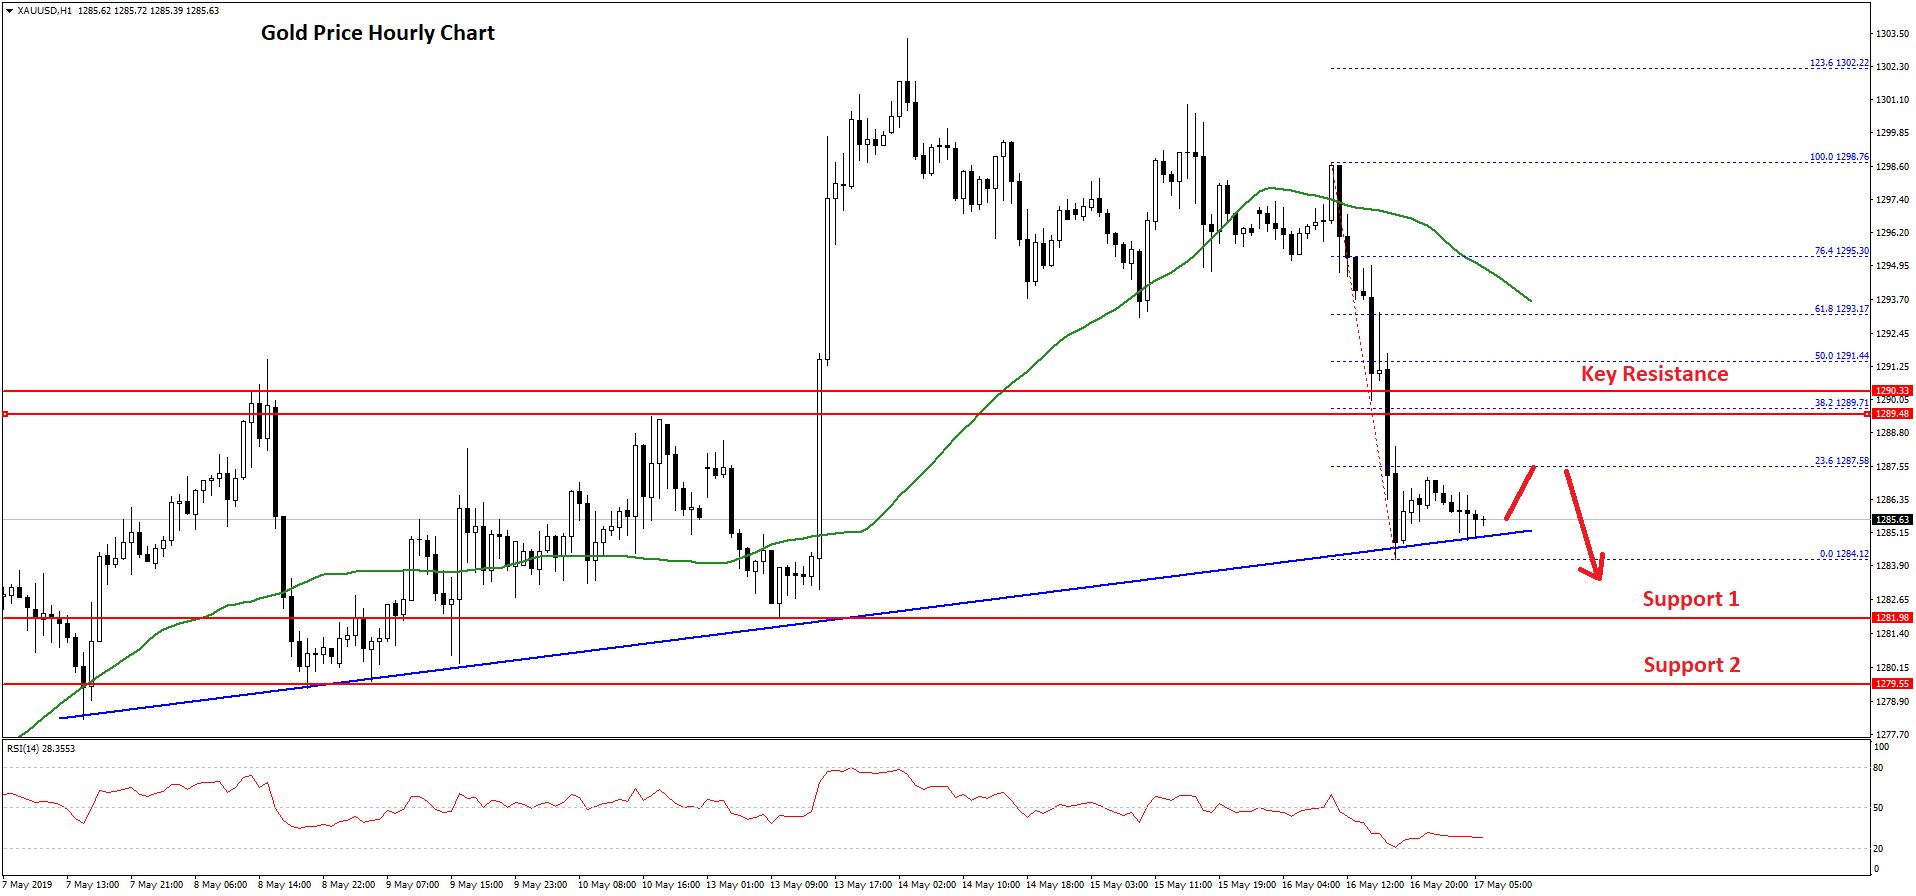
There was even a close below the $1,290 level and the 50 hourly simple moving average. A swing low was formed near the $1,284 level and the price is currently consolidating losses.
An initial resistance is near the $1,287 level and the 23.6% Fib retracement level of the latest decline from the $1,298 high to $1,284 low. On the upside, there is a strong resistance formed near the $1,289 and $1,290 levels.
Besides, the 50% Fib retracement level of the latest decline from the $1,298 high to $1,284 low is near the $1,291 level to act as a strong resistance.
The price may struggle to move higher towards $1,292 or $1,295 in the short term. Therefore, there is a risk of a downside break below the $1,284 and $1,282 support levels in the coming sessions.
Oil Price Technical Analysis
Crude oil price formed a strong support base near the $60.80 level and recently climbed higher against the US Dollar. The price gained bullish momentum and broke the $61.50 and $62.00 resistance levels.
The upward move was strong since there was a close above the $62.20 level and the 50 hourly simple moving average. It even broke the $63.00 resistance level and traded towards the $63.65 level.
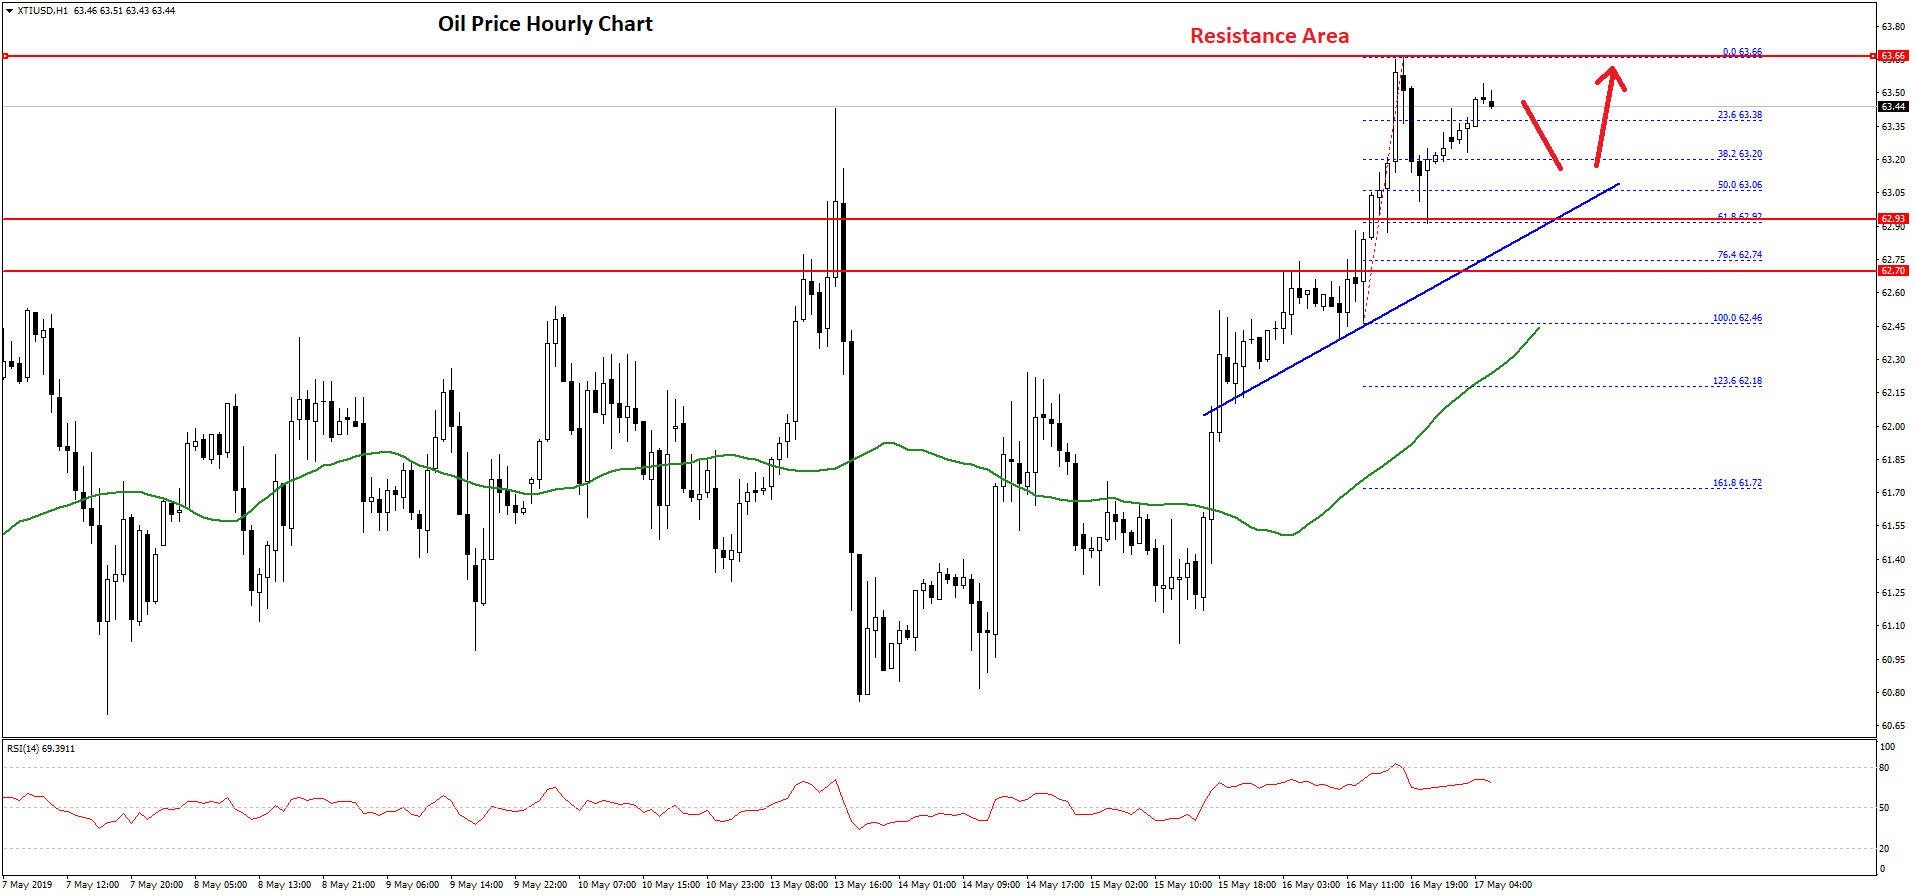
A swing high was formed at $63.66 and the price recently corrected lower below $63.20 and 50% Fib retracement level of the wave from the $62.46 low to $63.66 high.
However, the $63.00 and $62.95 levels acted as a support. Besides, the 61.8% Fib retracement level of the wave from the $62.46 low to $63.66 high provided a strong support.
More importantly, there is a bullish trend line in place with support near $63.02 on the hourly chart of XTI/USD. As long as the price is trading above the $63.00 support level, it is likely to trade higher in the near term. Below $63.00, the price could retest the $62.40 support.
On the upside, an immediate resistance is near the $63.50 level, above which oil price is likely to break the $63.66 swing high. The next important resistance is near the $64.00 level, where sellers may emerge.
Trade over 50 forex markets 24 hours a day with FXOpen. Take advantage of low commissions, deep liquidity, and spreads from 0.0 pips. Open your FXOpen account now or learn more about trading forex with FXOpen.
This article represents the opinion of the Companies operating under the FXOpen brand only. It is not to be construed as an offer, solicitation, or recommendation with respect to products and services provided by the Companies operating under the FXOpen brand, nor is it to be considered financial advice.
Stay ahead of the market!
Subscribe now to our mailing list and receive the latest market news and insights delivered directly to your inbox.

Latest from Forex Analysis
Latest articles

Weekly Market Wrap With Gary Thomson: Nasdaq, EUR/USD, USD/CHF, Brent Crude Oil, Googl Shares
Get the latest scoop on the week's hottest headlines, all in one convenient video. Join Gary Thomson, the COO of FXOpen UK, as he breaks down the most significant news reports and shares his expert insights.
- Nasdaq Composite: Worst Session

Analysis of AUD/USD: Exchange Rate Falls to Early May Low
As indicated by the 4-hour AUD/USD chart today:
→ the rate fell below 0.652, a level last seen on May 2;
→ the RSI indicator dropped below 15, a level last seen during the panic over the spread of COVID-19

Analysis of AMZN Stock: Price at 1.5-Month Low
As shown in the AMZN chart, the stock price dropped below:
→ the psychological level of $180;
→ the mid-June interim low.
The last time AMZN traded below $180 was in early June.
Thus, AMZN has faced sell-offs, similar to other tech