


Gold Price Drops While Crude Oil Price Aims Fresh Increase
FXOpen

Gold price started a fresh decline and traded below $1,650. Crude oil price is holding the $84.25 support and might start a fresh increase.
Important Takeaways for Gold and Oil
· Gold price failed to surpass $1,680 and started a fresh decline against the US Dollar.
· There is a key bearish trend line forming with resistance near $1,638 on the hourly chart of gold.
· Crude oil price is showing positive signs above the $84.25 support zone.
· There is a major bullish trend line forming with support near $83.80 on the hourly chart of XTI/USD.
Gold Price Technical Analysis
Gold price failed to gain strength for a move above the $1,680 resistance against the US Dollar. The price started a fresh decline and traded below the $1,650 support level.
There was a clear move below the $1,640 support zone and the 50 hourly simple moving average. The price traded as low as $1,622 on FXOpen and recently there was a recovery wave. The price was able to clear the $1,630 resistance zone.
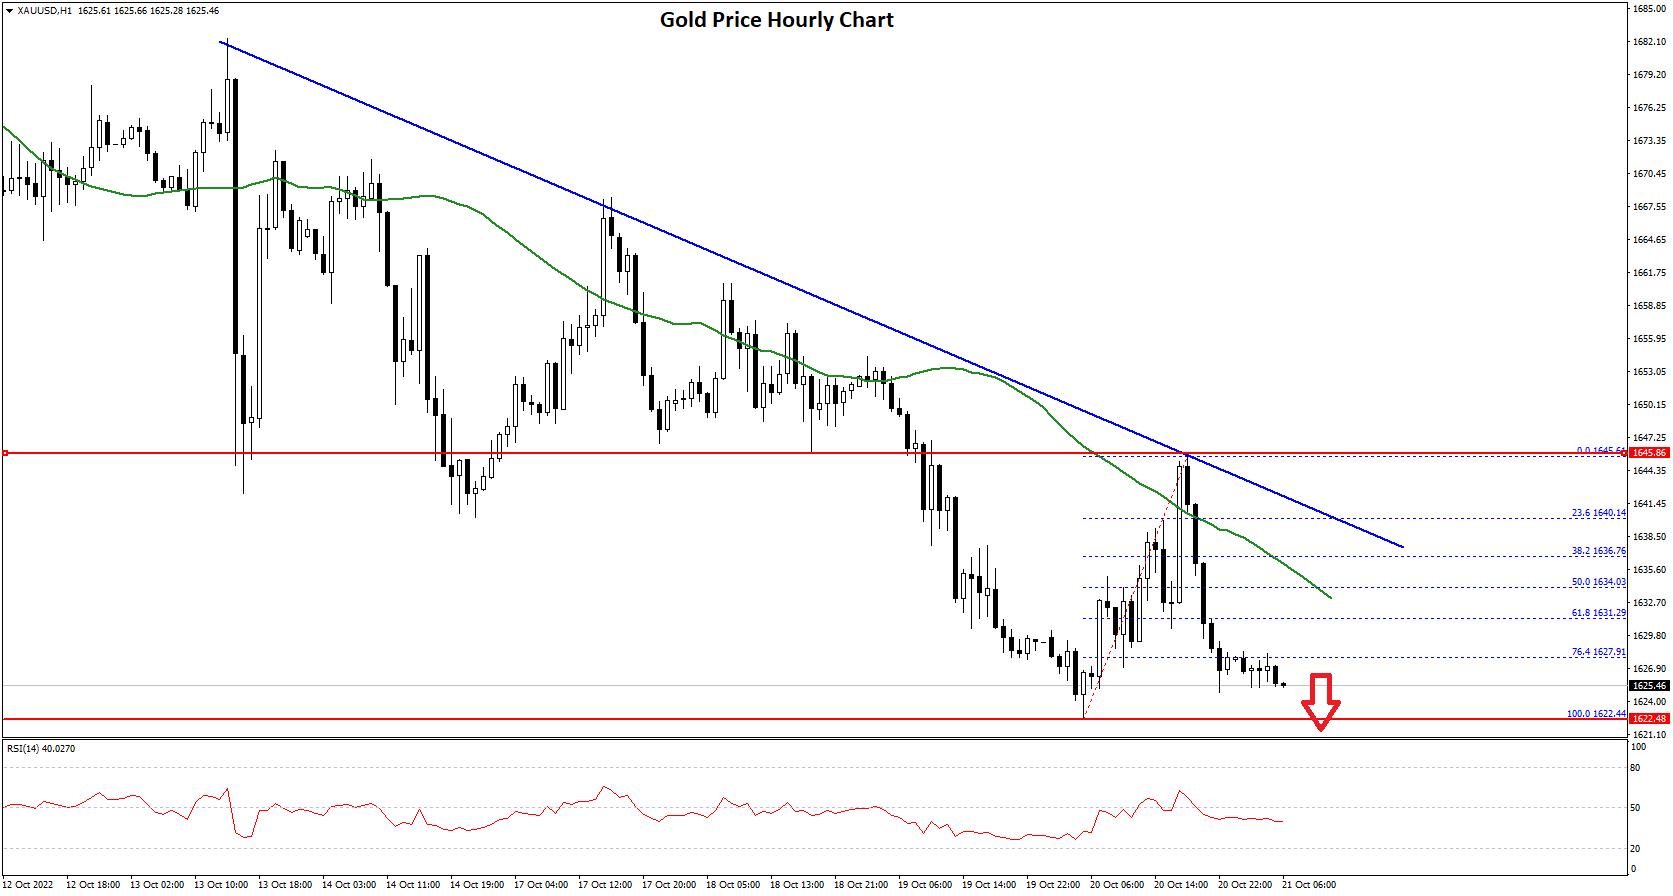
However, the price failed to clear $1,645 and started another decline. It traded below the 50% Fib retracement level of the upward move from the $1,622 swing low to $1,645 high.
It is now trading below the $1,630 level. There was also a move below the 76.4% Fib retracement level of the upward move from the $1,622 swing low to $1,645 high. An immediate support on the downside is near the $1,622 level.
The next major support is near the $1,620 level, below which there is a risk of a larger decline. In the stated case, the price could decline sharply towards the $1,600 support zone.
On the upside, the price is facing resistance near the $1,635 level. The first major resistance is near the $1,638 level. There is also a key bearish trend line forming with resistance near $1,638 on the hourly chart of gold.
The main resistance is now forming near the $1,645 level, above which it could even test $1,650. A clear upside break above the $1,650 resistance could send the price towards $1,680.
Oil Price Technical Analysis
Crude oil price started a fresh decline from the $86.92 resistance zone against the US Dollar. The price traded below the $85.00 support zone to move into a short-term bearish zone.
The price even traded below the 38.2% Fib retracement level of the upward move from the $81.27 swing low to $86.92 high. However, the bulls were seen active near the $84.25 support zone and the 50 hourly simple moving average.
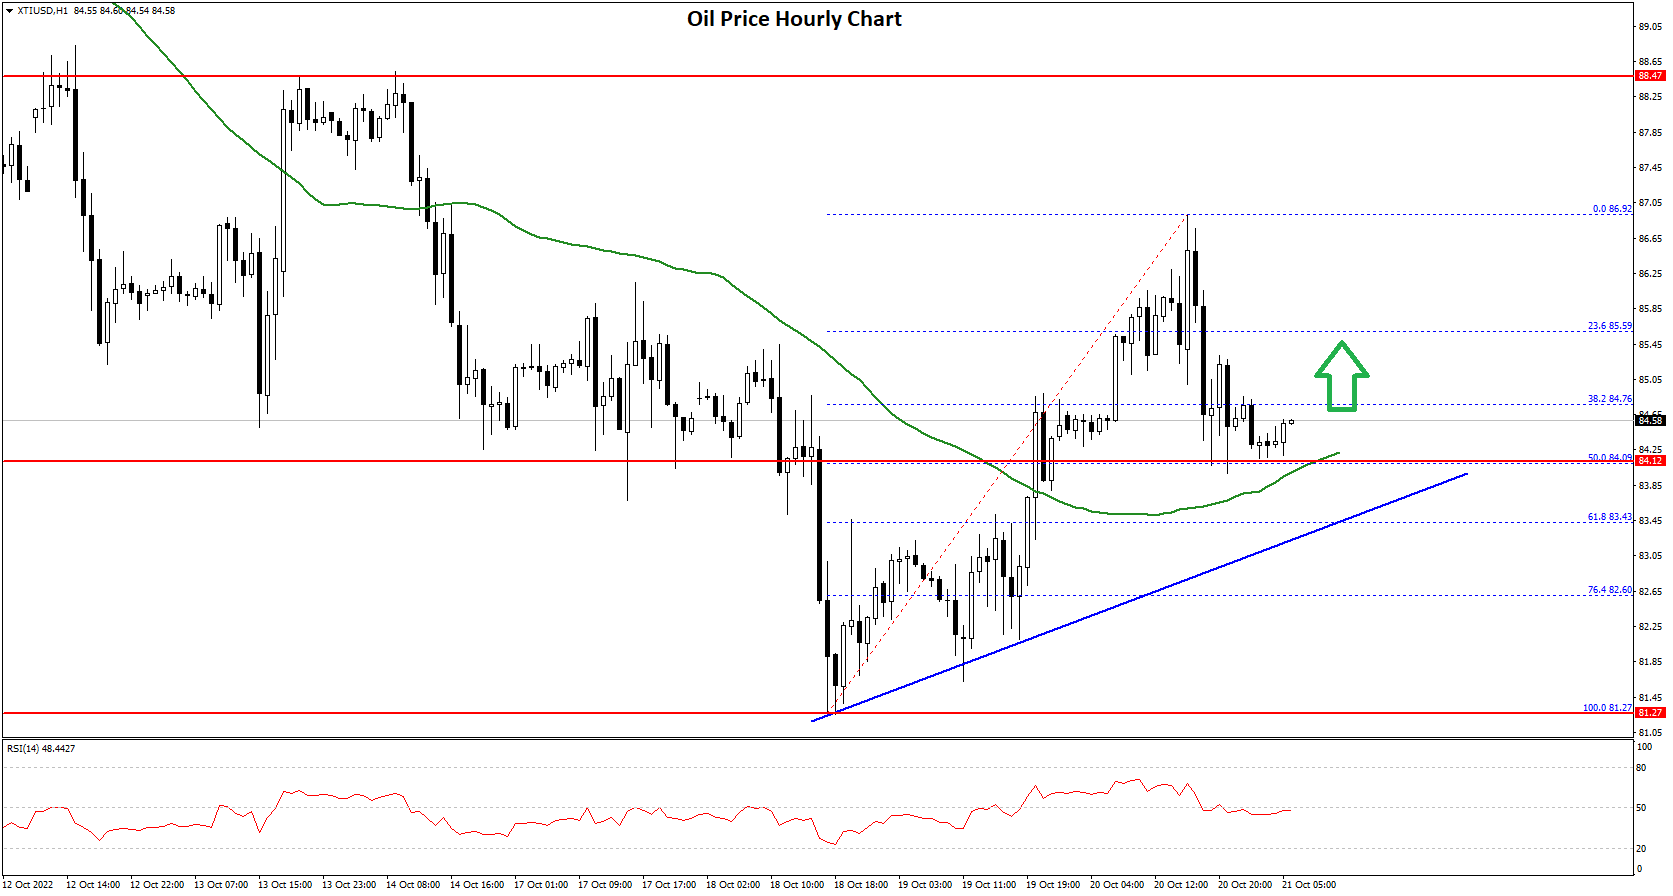
The price stayed above the 50% Fib retracement level of the upward move from the $81.27 swing low to $86.92 high. There is also a major bullish trend line forming with support near $83.80 on the hourly chart of XTI/USD.
It is now facing resistance near the $84.75 level. The main resistance sits near the $85.50 level, above which the price might accelerate higher towards $86.50 or even $87.00.
On the downside, an immediate support is near the $84.25 level. The next major support is near the $83.80 level. If there is a downside break, the price might decline towards $82.00. Any more losses may perhaps open the doors for a move towards the $80.00 support zone.
This forecast represents FXOpen Companies opinion only, it should not be construed as an offer, invitation or recommendation in respect to FXOpen Companies products and services or as financial advice.
Trade over 50 forex markets 24 hours a day with FXOpen. Take advantage of low commissions, deep liquidity, and spreads from 0.0 pips (additional fees may apply). Open your FXOpen account now or learn more about trading forex with FXOpen.
Start trading commodity CFDs with tight spreads (additional fees may apply). Open your trading account now or learn more about trading commodity CFDs with FXOpen.
This article represents the opinion of the Companies operating under the FXOpen brand only. It is not to be construed as an offer, solicitation, or recommendation with respect to products and services provided by the Companies operating under the FXOpen brand, nor is it to be considered financial advice.
Stay ahead of the market!
Subscribe now to our mailing list and receive the latest market news and insights delivered directly to your inbox.


Latest articles

AUD/CAD: Months of Indecision — Is a Breakout Finally Coming?
The Australian dollar has clawed back most of its end-of-June losses, when it touched three-month lows against the greenback amid escalating Middle East tensions. Since then, sentiment has improved: the RBA's Assistant Governor Sarah Hunter signalled the board stands ready

USD/JPY: Battling at the Top of the Triangle
On 3 July, Japan's Finance Minister, Satsuki Katayama, stated that the Ministry of Finance remains in close contact with US authorities regarding developments in USD/JPY as the yen traded near its weakest level in almost 40 years. Similar verbal

Dow Jones (DJIA): Consolidation Beyond the Trend
Federal Reserve Chair Kevin Warsh testified before Congress on 14–15 July, reaffirming the Fed's commitment to bringing inflation back to target while providing no clear guidance on the future path of interest rates. Meanwhile, June inflation data came in