


FXOpen

Gold price is attempting a fresh increase above the $1,785 resistance zone. Crude oil price is recovering and could gain pace if there is a clear move above the $73.20 level.
Important Takeaways for Gold and Oil
· Gold price is showing a few bearish signs below the $1,800 zone against the US Dollar.
· There was a break below a key bullish trend line with support near $1,784 on the hourly chart of gold.
· Crude oil price started a recovery wave above the $70.00 and $72.00 levels.
· There was a break below a major bullish trend line with support near $72.30 on the hourly chart of XTI/USD.
Gold Price Technical Analysis
Gold price started a fresh decline from well above the $1,800 zone against the US Dollar. The price declined heavily, and it even broke the $1,780 support zone.
The price even settled below the $1,800 level and the 50 hourly simple moving average. Finally, there was a break below the $1,770 level. A low was formed near $1,761 on FXOpen before there was a recovery wave.
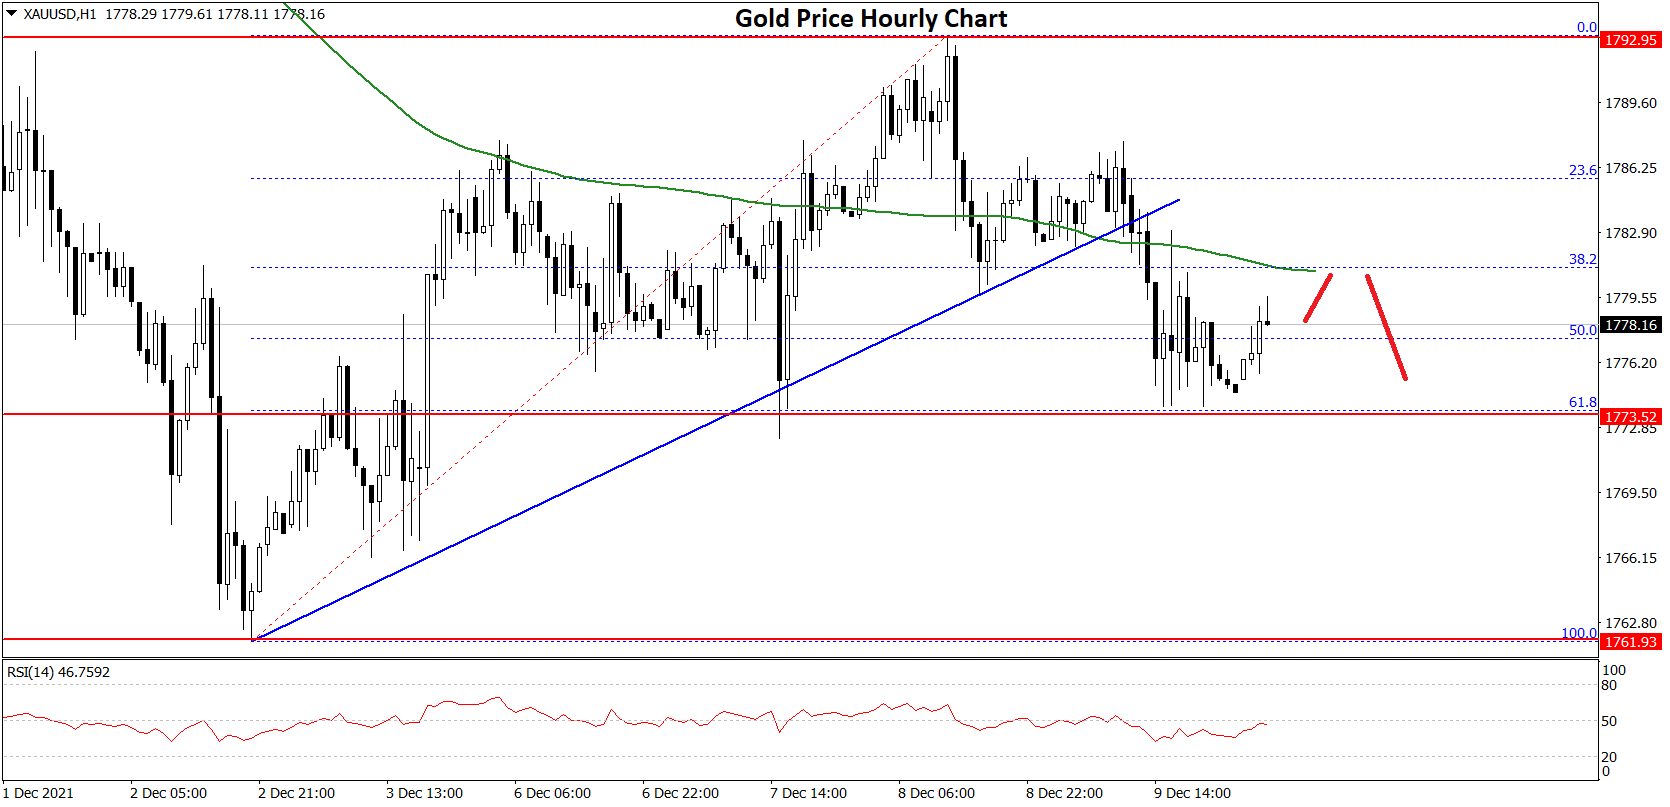
The price climbed above $1,780, but it stayed below $1,800. A high was formed near $1,792 and the price corrected lower. There was a break below the $1,785 level and the $1,780 support.
The price even traded below the 50% Fib retracement level of the upward move from the $1,761 swing low to $1,792 high. There was also a break below a key bullish trend line with support near $1,784 on the hourly chart of gold.
However, the bulls remained active near $1,774. The price is also stable above the 61.8% Fib retracement level of the upward move from the $1,761 swing low to $1,792 high.
An immediate resistance on the upside is near the $1,780 level and the 50 hourly simple moving average. The main resistance is near the $1,785 level. A close above the $1,785 level could open the doors for a steady increase towards $1,800.
The next major resistance sits near the $1,820 level. On the downside, an initial support is near the $1,774 level.
The first major support is near the $1,760 level. A downside break below the $1,760 support zone may possibly spark a steady decline. In the stated case, the price could test the $1,740 support.
Oil Price Technical Analysis
Crude oil price started a steady increase from the $62.50 support zone against the US Dollar. The price broke the $65.00 resistance zone to move into a positive zone.
The price even cleared the $70.00 level and settled above the 50 hourly simple moving average. However, the price failed to gain pace for a move above the $73.20 zone. A high was formed near $73.13 before the price corrected lower.
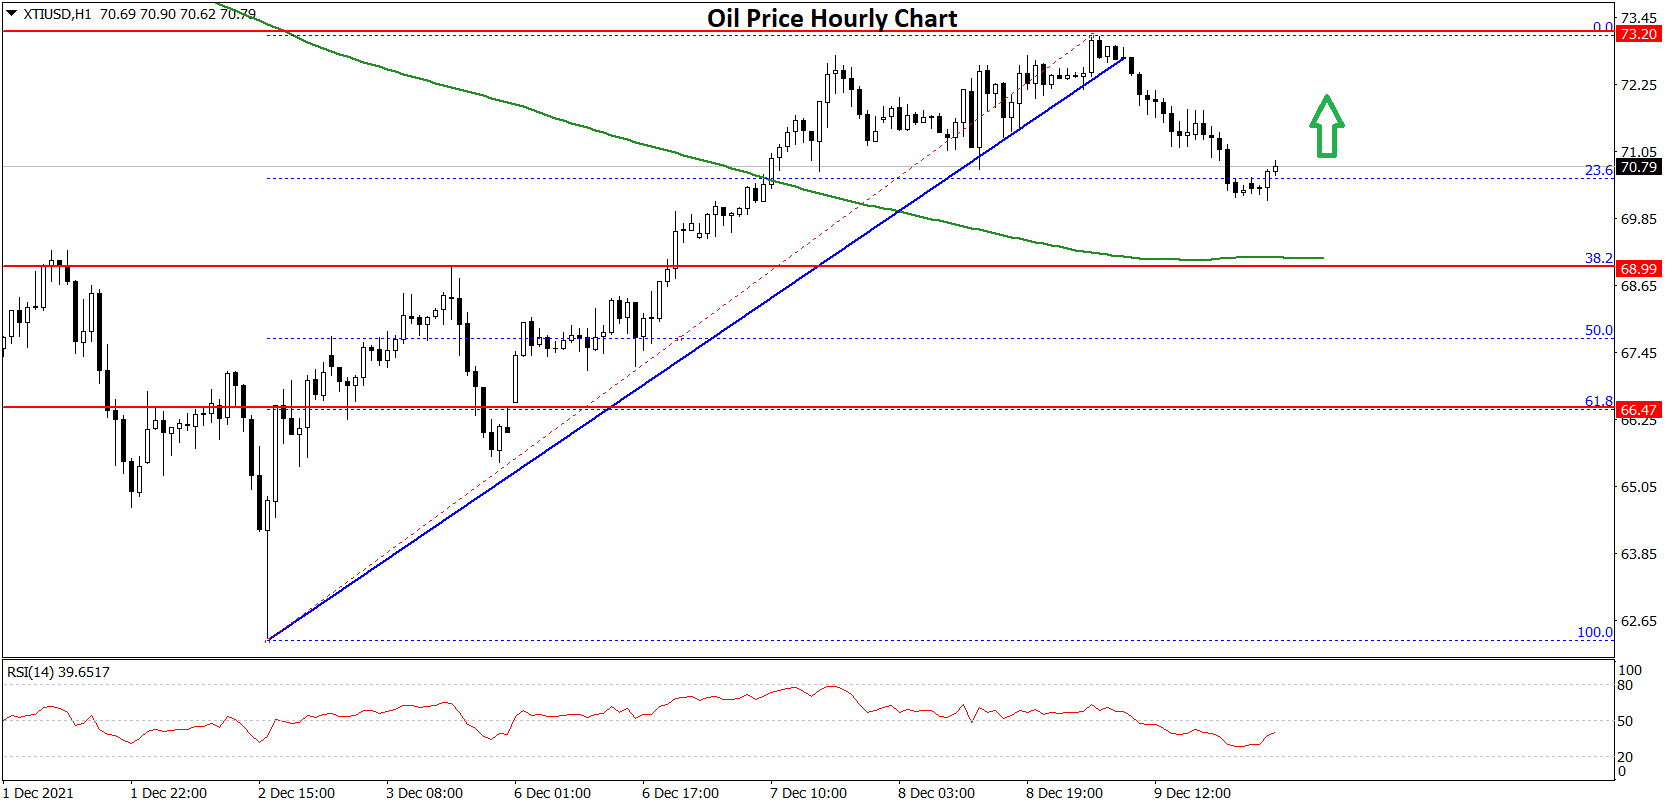
It corrected a few points below the $72.00 level. The price even traded below the 23.6% Fib retracement level of the upward move from the $62.29 swing low to $73.13 high.
There was also a break below a major bullish trend line with support near $72.30 on the hourly chart of XTI/USD. On the downside, an initial support is near the $70.00 level.
The first key support is near the $68.00 level or the 50% Fib retracement level of the upward move from the $62.29 swing low to $73.13 high, below which there is a risk of a larger decline. The next major support sits near the $62.50 level
On the upside, the price is facing resistance near the $72.50 level. The next key resistance is near the $73.20 level, above which the price might accelerate higher towards $75.50.
This forecast represents FXOpen Markets Limited opinion only, it should not be construed as an offer, invitation or recommendation in respect to FXOpen Markets Limited products and services or as financial advice.
Trade over 50 forex markets 24 hours a day with FXOpen. Take advantage of low commissions, deep liquidity, and spreads from 0.0 pips (additional fees may apply). Open your FXOpen account now or learn more about trading forex with FXOpen.
This article represents the opinion of the Companies operating under the FXOpen brand only. It is not to be construed as an offer, solicitation, or recommendation with respect to products and services provided by the Companies operating under the FXOpen brand, nor is it to be considered financial advice.
Stay ahead of the market!
Subscribe now to our mailing list and receive the latest market news and insights delivered directly to your inbox.


Latest articles

The Price of Silver Is Recovering After a Two-Day Decline
As can be seen on the XAG/USD chart, the price of silver is recovering after forming yesterday’s low below the $79 level. The price per ounce has already exceeded $86 today (+10% in less than 24 hours!).
Volatility

Alibaba (BABA) Shares Drop Approximately 10% Over the Week
Last Wednesday, the closing price of Alibaba (BABA) shares was $152.28, while the closing price yesterday was $135.59, marking a 2026 low.
The roughly 10% decline was driven by a combination of bearish factors, including:
→ Unexpected resignation of

Market Analysis: Gold Under Pressure as WTI Crude Extends Rally During Iran War
Gold price extended losses below $5,100 before the bulls appeared. WTI Crude oil prices are rising and could climb further higher toward $80.00.
Important Takeaways for Gold and WTI Crude Oil Prices Analysis Today
· Gold price failed to