


Gold Price Faces Resistance While Oil Price Aims Higher
FXOpen

Gold price started a fresh decline from the $1,920 resistance. Crude oil price is rising and might gain pace above the $107 resistance.
Important Takeaways for Gold and Oil
· Gold price started a fresh decline from well above the $1,900 zone against the US Dollar.
· There is a key bearish trend line forming with resistance near $1,840 on the hourly chart of gold.
· Crude oil price gained pace after it broke the $102 and $104 resistance levels.
· There was a break above a major bearish trend line with resistance near $104.05 on the hourly chart of XTI/USD.
Gold Price Technical Analysis
Gold price struggled to gain pace for a move above the $1,920 resistance against the US Dollar. The price started a fresh decline below the $1,900 support zone.
There was a clear move below the $1,880 level and the 50 hourly simple moving average. The price even declined below the $1,850 support to move into a bearish zone. It traded as low as $1,810 on FXOpen and now correcting losses.
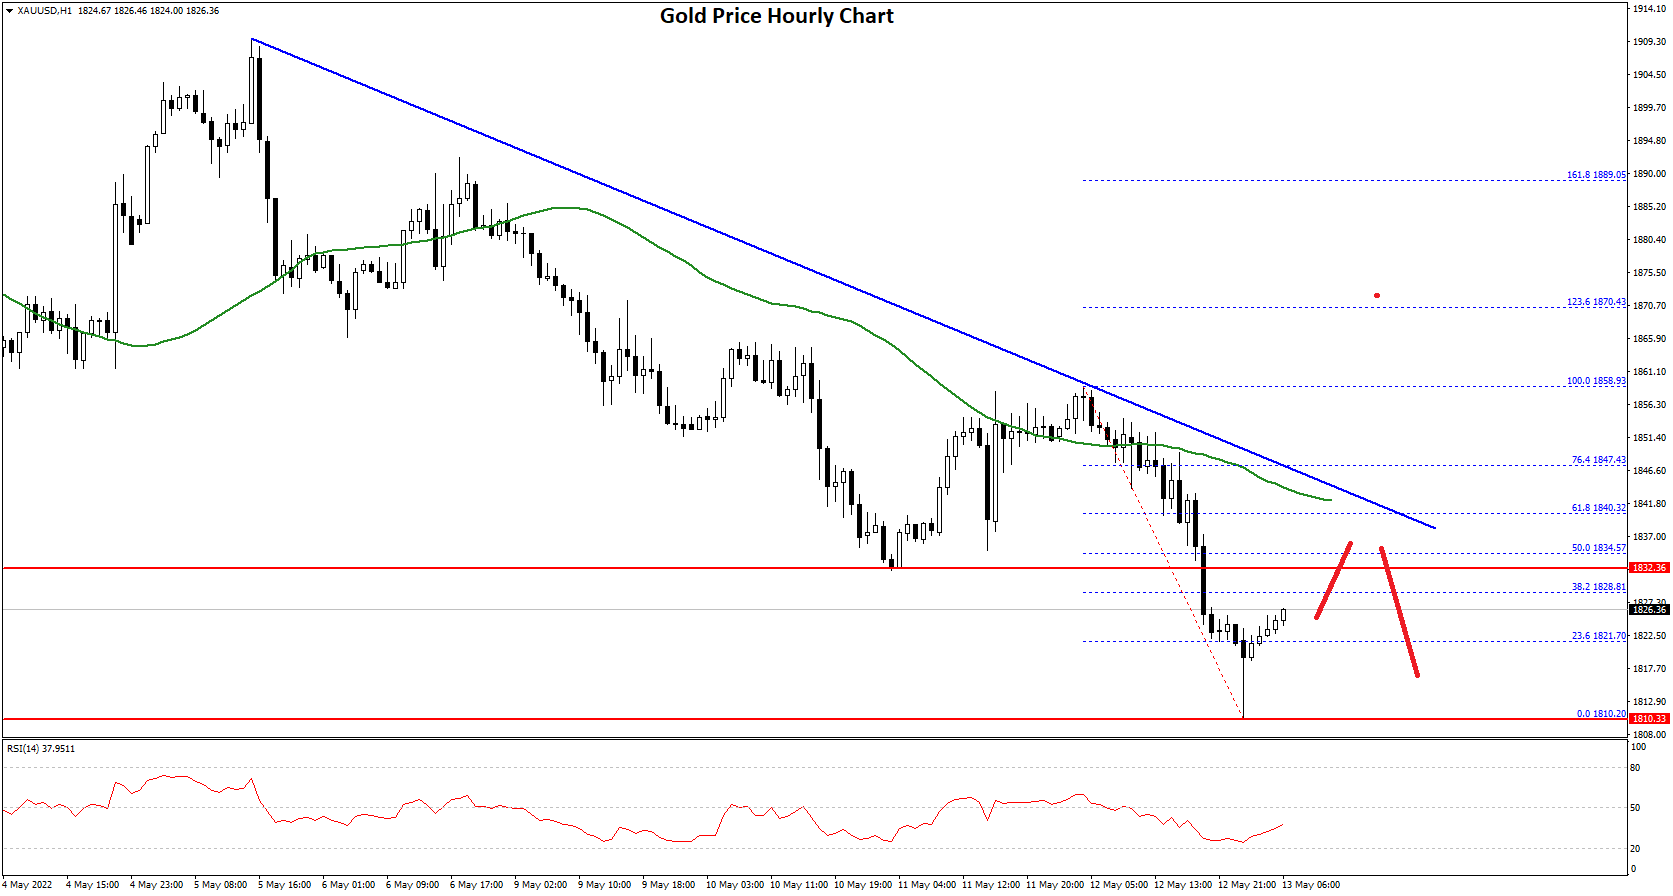
There was a move above the $1,820 resistance. The price broke the 23.6% Fib retracement level of the downward move from the $1,858 swing high to $1,810 low.
On the upside, the price is facing resistance near the $1,835 level. It is near the 50% Fib retracement level of the downward move from the $1,858 swing high to $1,810 low. Besides, there is a key bearish trend line forming with resistance near $1,840 on the hourly chart of gold.
The main resistance is now forming near the $1,840 level. A close above the $1,840 level could open the doors for a steady increase towards $1,880. The next major resistance sits near the $1,900 level.
On the downside, an initial support is near the $1,820 level. The next major support is near the $1,810 level, below which there is a risk of a larger decline and the price might even struggle to stay above $1,800.
Oil Price Technical Analysis
Crude oil price formed a base above the $98 level against the US Dollar. The price started a major increase above the $99 and $100 resistance levels.
The price climbed above the $102 level and the 50 hourly simple moving average. There was a break above a major bearish trend line with resistance near $104.05 on the hourly chart of XTI/USD.
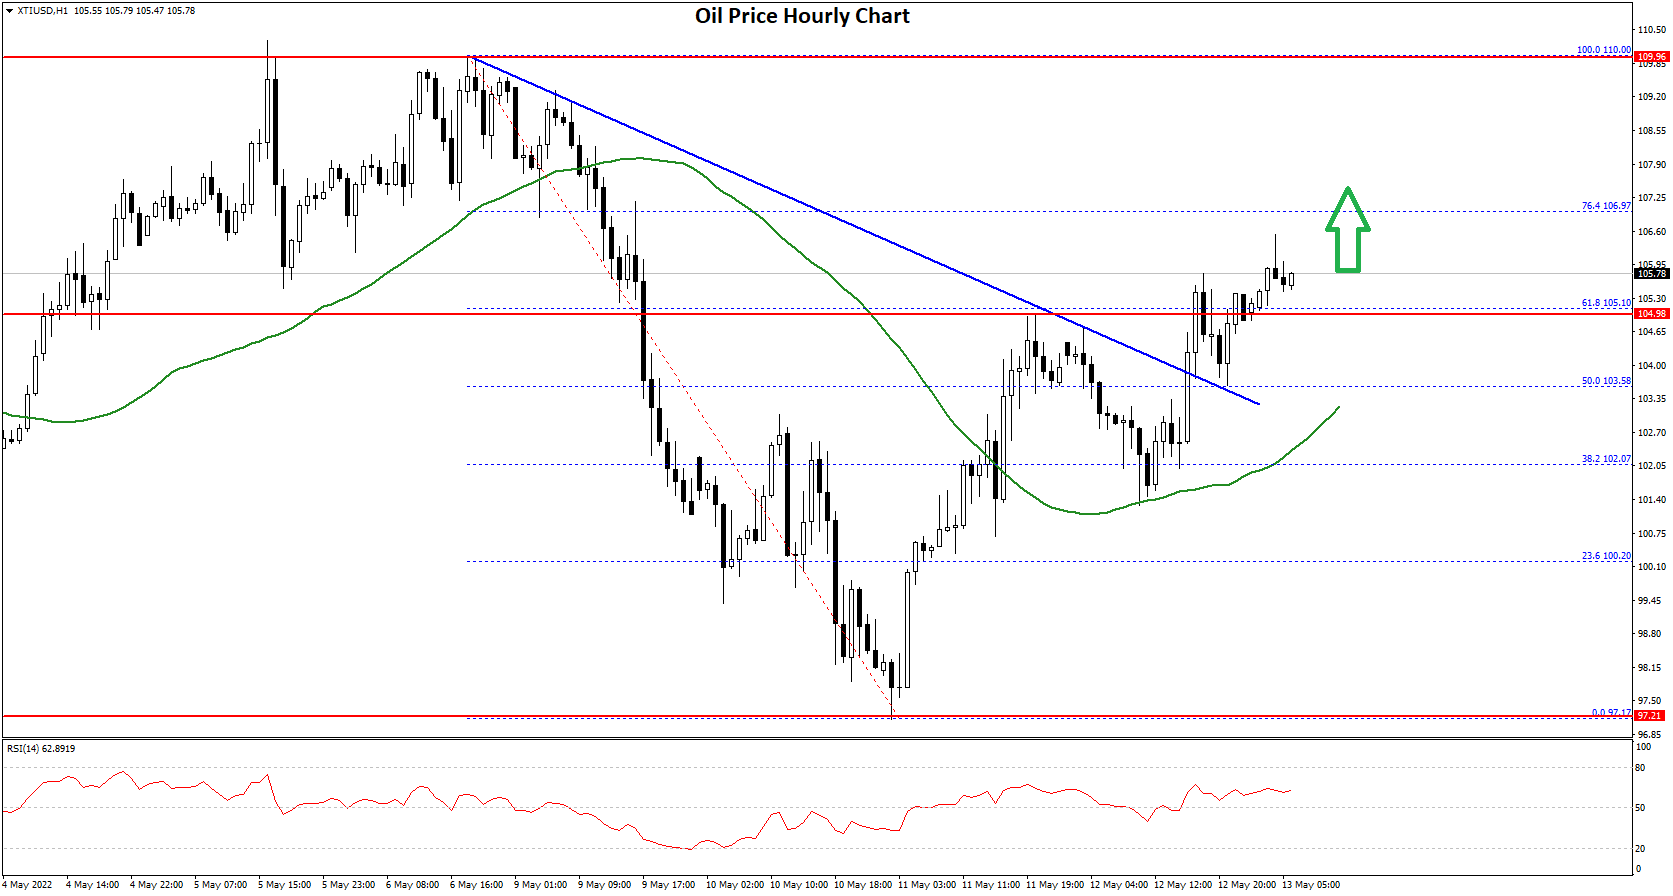
The price was able to settle above the $104 level and the 50% Fib retracement level of the key decline from the $110 swing high to $97.17 swing low. It is now showing positive signs above the $106 level. An immediate resistance is near the $107 level.
The next key resistance is near the $108.00 level, above which the price might accelerate higher towards $110.00. An immediate support is near the $105.10 level.
The next major support is near the $103.30 level and the 50 hourly simple moving average. If there is a downside break, the price might decline towards $102. Any more losses may perhaps open the doors for a move towards the $100 support zone in the coming sessions.
This forecast represents FXOpen Markets Limited opinion only, it should not be construed as an offer, invitation or recommendation in respect to FXOpen Markets Limited products and services or as financial advice.
Trade over 50 forex markets 24 hours a day with FXOpen. Take advantage of low commissions, deep liquidity, and spreads from 0.0 pips (additional fees may apply). Open your FXOpen account now or learn more about trading forex with FXOpen.
This article represents the opinion of the Companies operating under the FXOpen brand only. It is not to be construed as an offer, solicitation, or recommendation with respect to products and services provided by the Companies operating under the FXOpen brand, nor is it to be considered financial advice.
Stay ahead of the market!
Subscribe now to our mailing list and receive the latest market news and insights delivered directly to your inbox.


Latest articles

Weekly Market Insights with Gary Thomson: The Week of Central Banks and Earnings
In this video, we’ll explore the key economic events and market trends, shaping the financial landscape. Get ready for insights into financial markets to help you navigate the week ahead. Let’s dive in!
In this episode of Market

Intel at a Crossroads: Earnings Beat Meets Technical Resistance
Intel has just delivered its strongest quarter in over fifteen years, and the market reaction says it all. Q2 2026 revenue surged 25% year-over-year to $16.1 billion, crushing the consensus estimate of $14.42 billion, while adjusted EPS of

Tesla: Complex Range Structure Breaks Down Following Quarterly Earnings
Tesla released its Q2 2026 results after the market closed on 22 July. Revenue increased 26% year-on-year to $28.24 billion, while vehicle deliveries reached a record 480,126 units. However, operating margin fell sharply to 1.4%, down from