


FXOpen

Gold price started a fresh decline below the $1,750 and $1,720 support levels. Crude oil price is still in a positive zone and it is approaching the $65.00 resistance.
Important Takeaways for Gold and Oil
- Gold price started a steady decline and it even broke the $1,700 support against the US Dollar.
- There is a major declining channel forming with resistance near $1,715 on the hourly chart of gold.
- Crude oil price traded to a new multi-month high near $64.96.
- There was a break above a key bearish trend line with resistance near $61.50 on the hourly chart of XTI/USD.
Gold Price Technical Analysis
Gold price struggled to stay above the $1,750 support and started a strong decline against the US Dollar. As a result, there was a break below the $1,720 and $1,715 support levels.
The price even declined below the $1,700 support and settled below the 50 hourly simple moving average. It traded as low as $1,687 on FXOpen and it is currently consolidating losses.
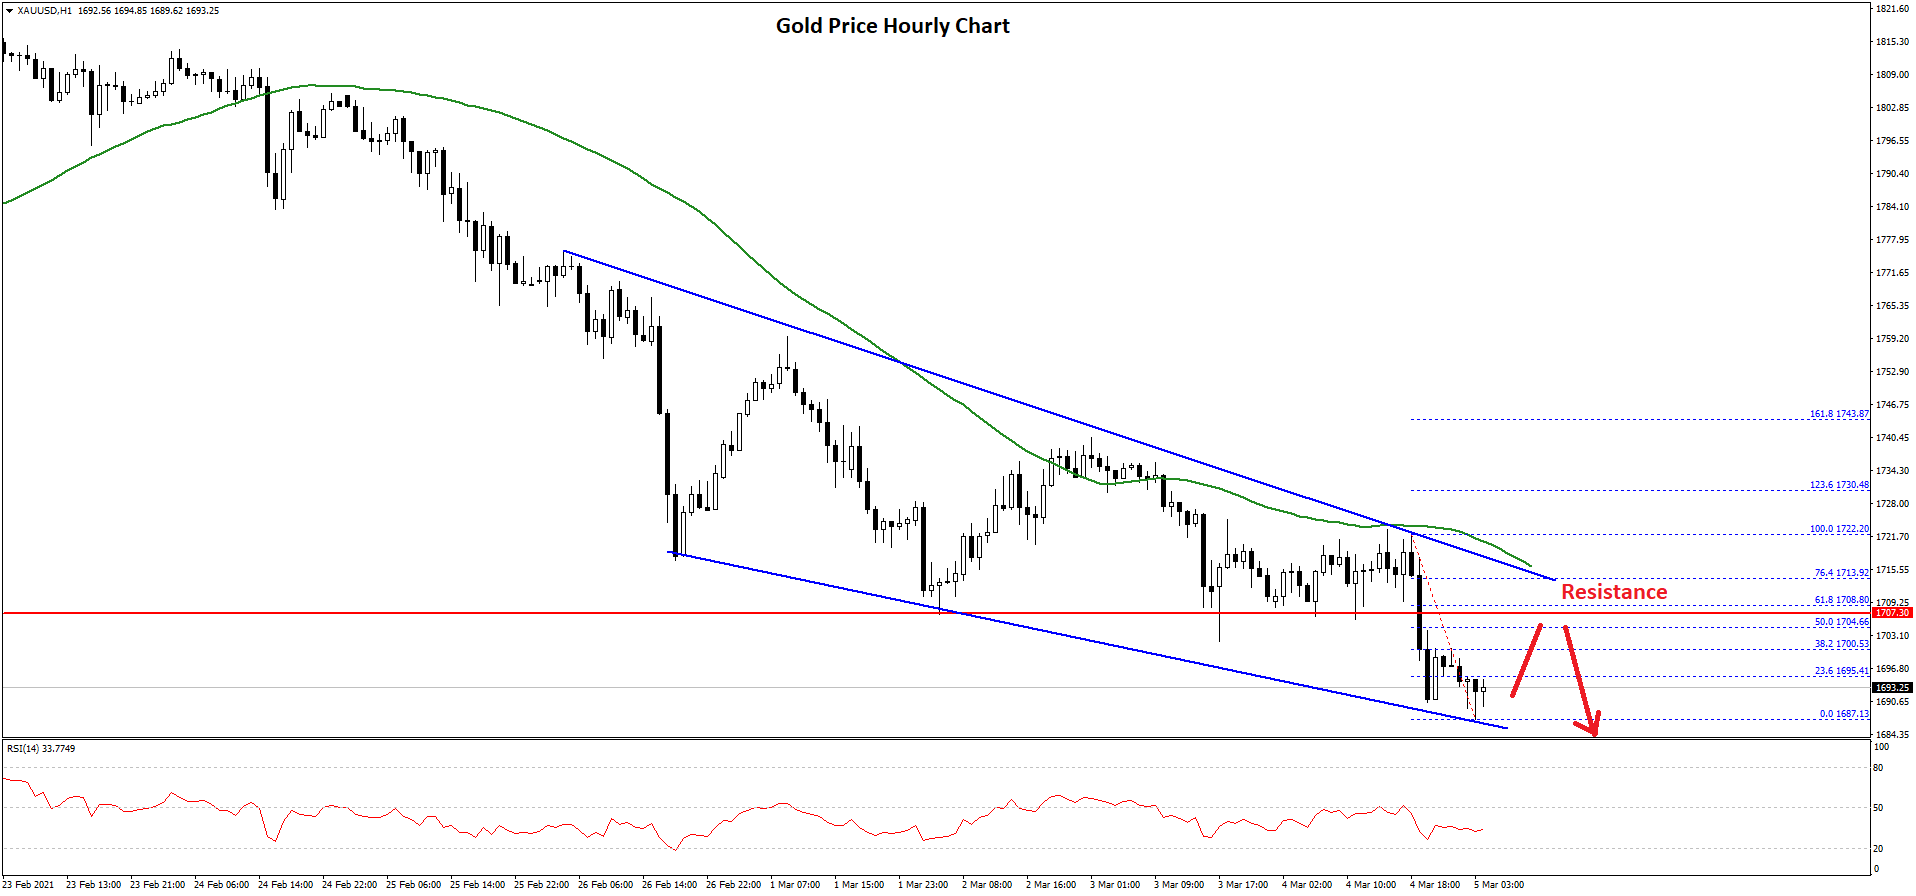
An initial resistance on the upside is near the $1,700 level. It is close to the 38.2% Fib retracement level of the recent decline from the $1,722 swing high to $1,687 low. The first major resistance is near the $1,710 level.
An intermediate resistance is near $1,705. It is close to the 50% Fib retracement level of the recent decline from the $1,722 swing high to $1,687 low. There is also a major declining channel forming with resistance near $1,715 on the hourly chart of gold.
The trend line is close to the 50 hourly simple moving average at $1,716. A close above the trend line resistance and a follow up move above $1,720 is needed for a fresh surge.
On the downside, the first major support is near the $1,688 level. The next major support is near the $1,675 level. Any more losses might call for a move towards the $1,650 support level.
Oil Price Technical Analysis
Crude oil price remains in a strong uptrend and it extended its upward move above the $62.00 resistance zone against the US Dollar. The price even cleared the $63.50 resistance level to move further into a positive zone.
During the increase, there was a break above a key bearish trend line with resistance near $61.50 on the hourly chart of XTI/USD. A new multi-month high was formed near $64.69 before the price started a downside correction.
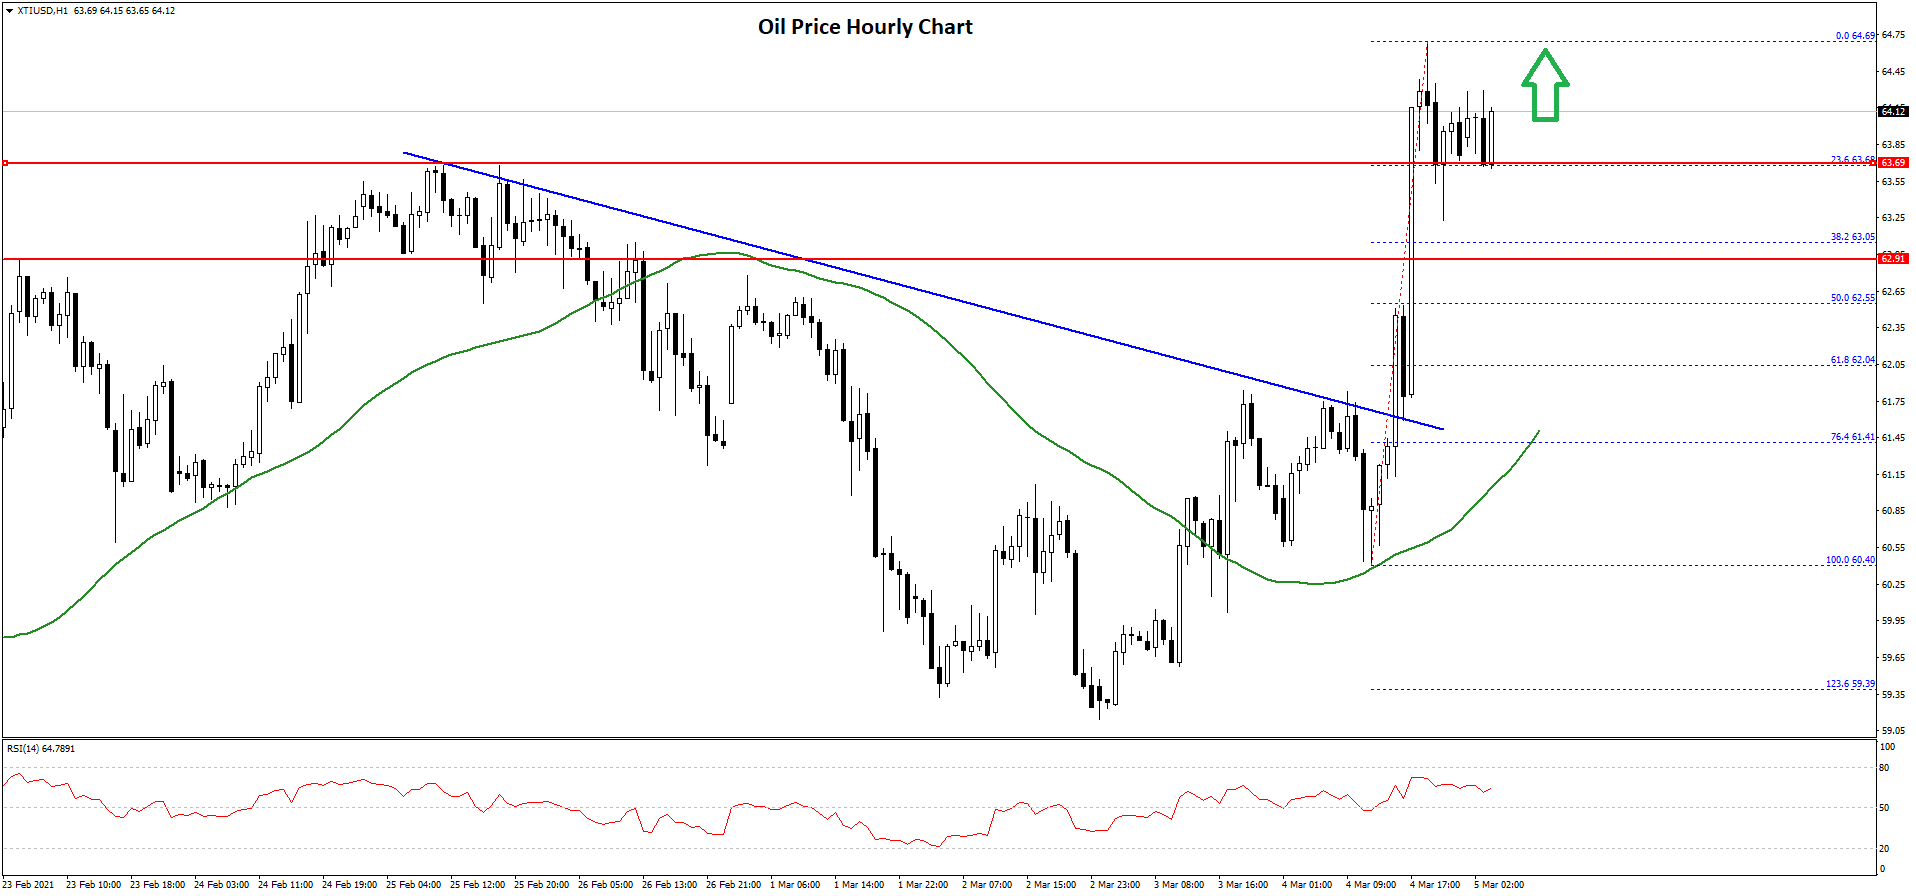
There was a break below the $64.00 support level, but the price remained well above the 50 hourly simple moving average. It tested the 23.6% Fib retracement level of the upward move from the $60.40 low to $64.69 high.
If there are more downsides, the price could slide towards the $63.00 support. The next major support is near the $62.55 level or the 50% Fib retracement level of the upward move from the $60.40 low to $64.69 high.
On the upside, an initial resistance is near the $64.50 level. The main resistance is near the $65.00 level. A successful break above the $65.00 resistance will most likely call for a move towards the $66.50 level. The next major hurdle for the bulls could be $68.00 in the near term.
Trade over 50 forex markets 24 hours a day with FXOpen. Take advantage of low commissions, deep liquidity, and spreads from 0.0 pips (additional fees may apply). Open your FXOpen account now or learn more about trading forex with FXOpen.
This article represents the opinion of the Companies operating under the FXOpen brand only. It is not to be construed as an offer, solicitation, or recommendation with respect to products and services provided by the Companies operating under the FXOpen brand, nor is it to be considered financial advice.
Stay ahead of the market!
Subscribe now to our mailing list and receive the latest market news and insights delivered directly to your inbox.


Latest articles

XTI/USD Chart Analysis: Oil Prices Remain Volatile
Against the backdrop of military developments in the Middle East, the situation in the oil market is evolving rapidly. Only two days have passed since 9 March, when we published a morning analytical note in which we:
→ highlighted the rise

Euro Recovers Early-Week Losses Ahead of Key Inflation Data
The euro is strengthening after declining earlier in the week. During the first trading sessions the single currency remained under pressure, but was later followed by a sharp rebound. The recovery was supported by easing geopolitical tensions in the Middle

Gold Price Holds Near Key Support
As the XAU/USD chart shows, the gold price has been holding within the $5,060–$5,200 range over the past several sessions.
Bullish view: the key support is the lower boundary of the long-term channel that has been