


Gold Price Surging While Crude Oil Price Might Correct Lower
FXOpen

Gold price surged above the $1,620 level and it might continue to rise. Crude oil price is currently correcting lower and it could decline towards the $52.50 support.
Important Takeaways for Gold and Oil
- Gold price gained traction and rallied above $1,610 and $1,620 against the US Dollar.
- There is a key bullish trend line forming with support near $1,615 on the hourly chart of gold.
- Crude oil price tested the $54.50 resistance area and corrected lower.
- There was a break below a connecting bullish trend line with support near $53.80 on the hourly chart of XTI/USD.
Gold Price Technical Analysis
In the past few days, gold price started a strong rise above the $1,580 pivot level against the US Dollar. The bulls gained strength, resulting in a sharp upward move above the $1,600 resistance area.
The upward move was such that the price settled above the $1,610 level and the 50 hourly simple moving average. Finally, it broke the $1,620 resistance and traded to a new 2020 high at $1,624 on FXOpen.
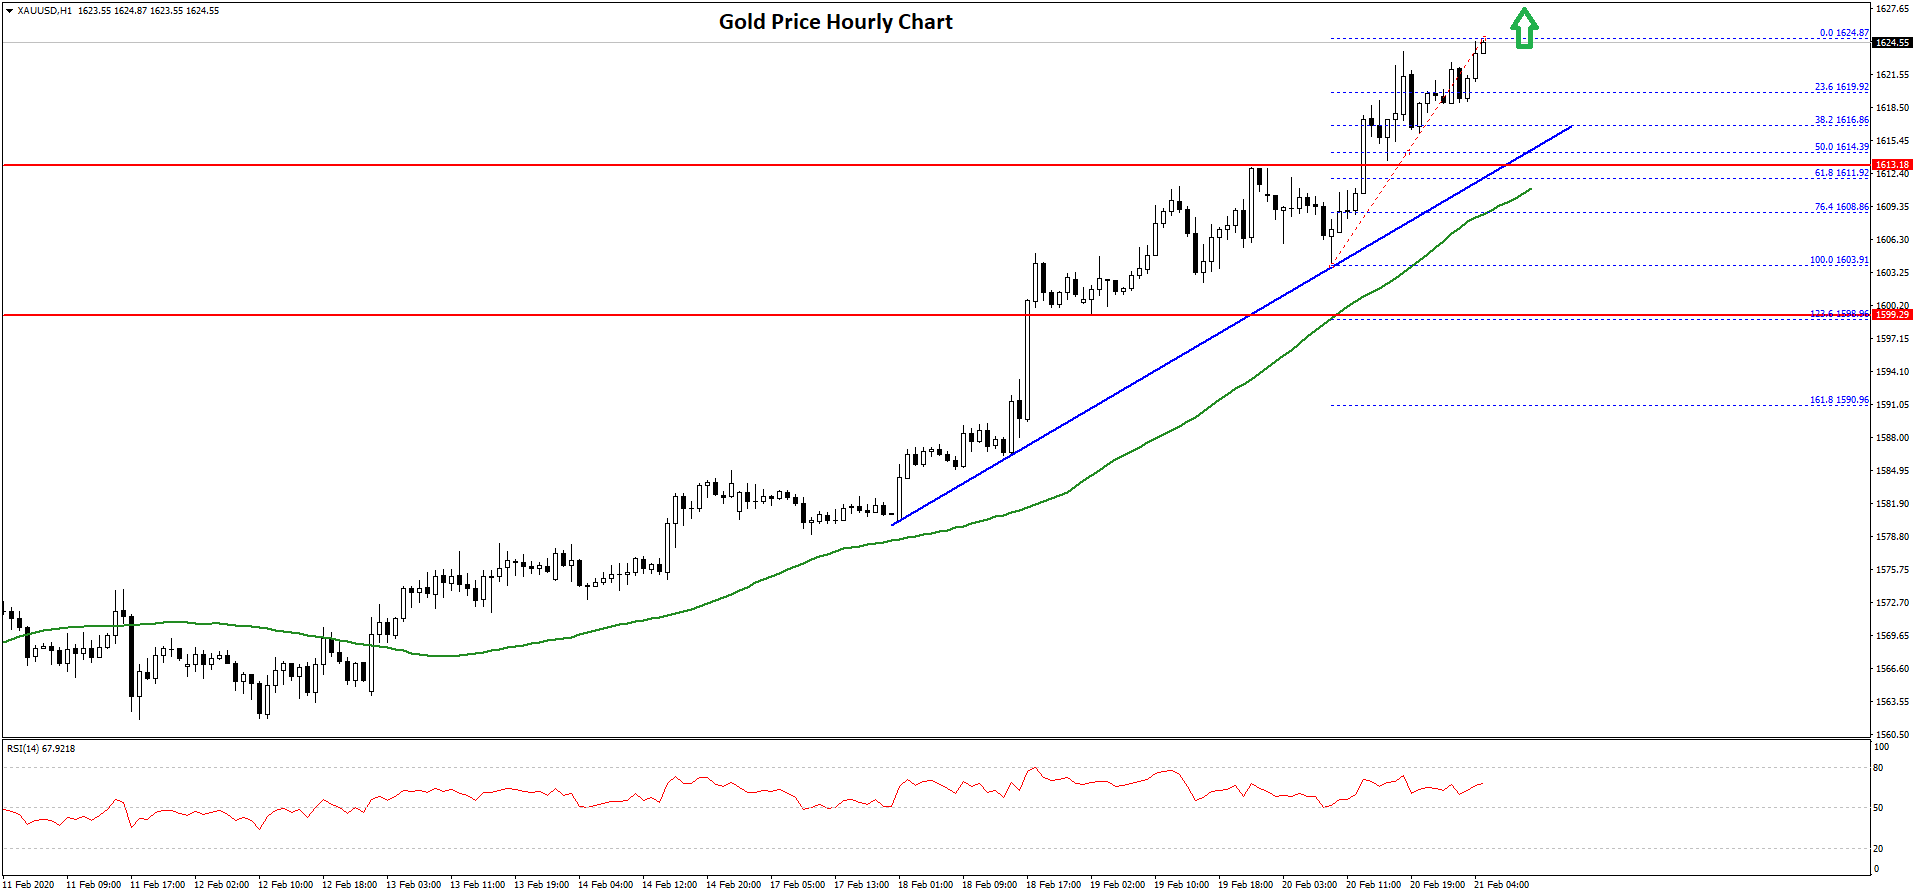
The price is currently trading with a strong bullish bias and it might continue to rise above the $1,625 level. The next key resistance on the upside is near the $1,640 and $1,645 levels.
On the downside, an initial support is near the $1,620 level. Besides, the 23.6% Fib retracement level of the recent rise from the $1,603 low to $1,624 high is also near the $1,620 level.
Moreover, there is a key bullish trend line forming with support near $1,615 on the hourly chart of gold. The trend line is close to the 50% Fib retracement level of the recent rise from the $1,603 low to $1,624 high.
Therefore, dips remain well supported on the downside near the $1,620 and $1,615 levels. The main support on the downside is now near the $1,610 level since it coincides with the 50 hourly simple moving average.
Oil Price Technical Analysis
There were also positive moves in crude oil price above the $52.50 and $53.20 levels against the US Dollar. The price even climbed above the $53.50 resistance area.
Finally, it rallied above the $54.00 level and settled above the 50 hourly simple moving average. The price traded as high as $54.62 and recently started a downside correction.
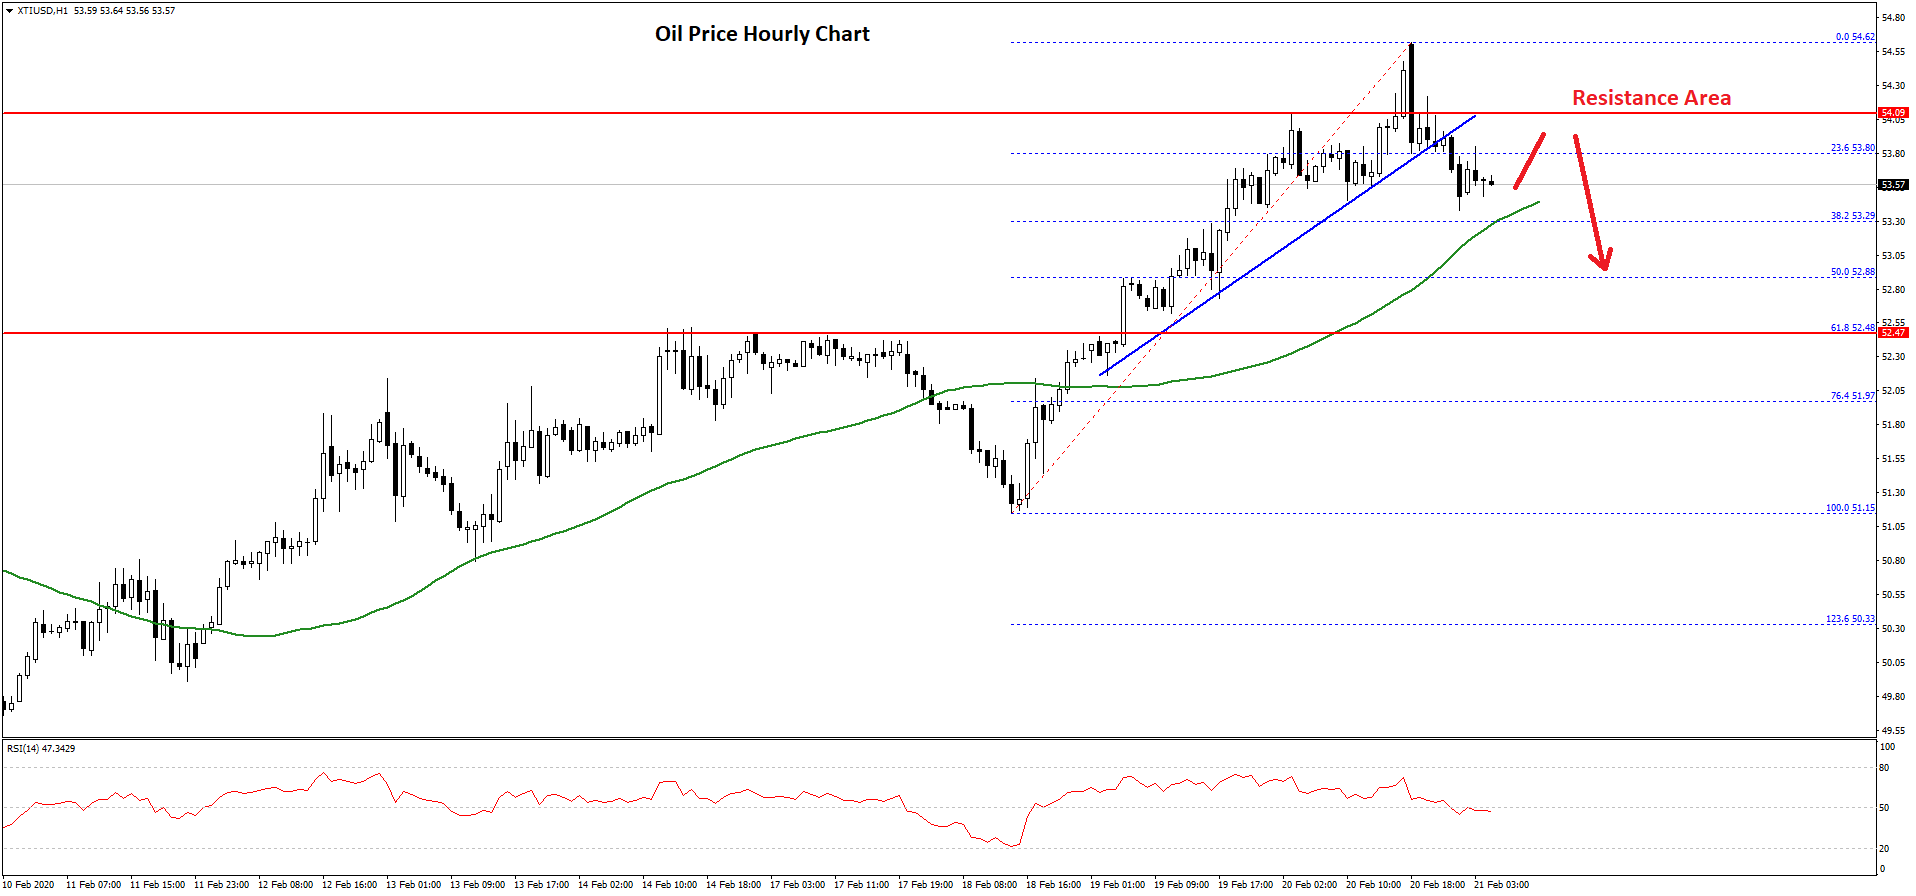
It traded below the $54.40 and $54.20 support levels. Besides, there was a break below the 23.6% Fib retracement level of the upward move from the $51.15 low to $54.62 high.
Besides, there was a break below a connecting bullish trend line with support near $53.80 on the hourly chart of XTI/USD. The price is now approaching the $53.50 support area and the 50 hourly simple moving average.
The first major support is near the $53.00 level. It is also close to the 50% Fib retracement level of the upward move from the $51.15 low to $54.62 high.
If the price fails to stay above the $53.50 and $53.00 support levels, it could decline sharply towards the $51.20 support level.
Conversely, crude oil price might start a fresh increase above the $54.00 level. However, a successful close above the $54.20 is needed for upside continuation towards the $55.00 level in the near term.
Trade over 50 forex markets 24 hours a day with FXOpen. Take advantage of low commissions, deep liquidity, and spreads from 0.0 pips (additional fees may apply). Open your FXOpen account now or learn more about trading forex with FXOpen.
This article represents the opinion of the Companies operating under the FXOpen brand only. It is not to be construed as an offer, solicitation, or recommendation with respect to products and services provided by the Companies operating under the FXOpen brand, nor is it to be considered financial advice.
Stay ahead of the market!
Subscribe now to our mailing list and receive the latest market news and insights delivered directly to your inbox.


Latest articles

USD/JPY and USD/CHF Near Key Levels: The Dollar Supported by the Fed
The US dollar continues to trend upwards following the Federal Reserve meeting, drawing support from the regulator’s moderately hawkish stance and comments by Jerome Powell. Markets interpret the Fed’s rhetoric as a signal that restrictive policy is likely

EUR/USD and GBP/USD consolidate ahead of the Fed decision
European currencies are showing subdued dynamics, entering a consolidation phase following their previous advance. Earlier, EUR/USD and GBP/USD broke out of their ranges and strengthened; however, the subsequent correction has led both pairs to retest the previously breached

Meta: V-Shaped Recovery Meets Heavy Volume Resistance
The movement in Meta Platforms shares is being driven by two competing narratives. On one hand, advertising revenue is benefiting from AI-based tools: the Advantage+ platform continues to support strong advertiser demand, and the analyst consensus for Q1 2026 revenue