


FXOpen

Gold price traded to a new yearly high at $1,557 and recently corrected sharply below $1,530. Conversely, crude oil price is trading nicely above the $55.70 and $55.25 supports.
Important Takeaways for Gold and Oil
- Gold price topped near the $1,557 level and recently declined sharply against the US Dollar.
- There was a break below a key bullish trend line with support near $1,530 on the hourly chart of gold.
- Crude oil price is trading with a positive bias and recently traded towards the $57.50 level.
- There was a break above a major bearish trend line with resistance near $55.55 on the hourly chart of XTI/USD.
Gold Price Technical Analysis
Earlier this week, gold price resumed its upward move above the $1,540 level against the US Dollar. The price even broke the $1,555 high and traded to a new yearly high at $1,557 before starting a downside correction.
The price declined sharply and broke the $1,540 and $1,525 support levels. The decline was such that there was a close below the $1,525 level and the 50 hourly simple moving average. A swing low was formed near $1,506 on FXOpen and the price is currently correcting losses.
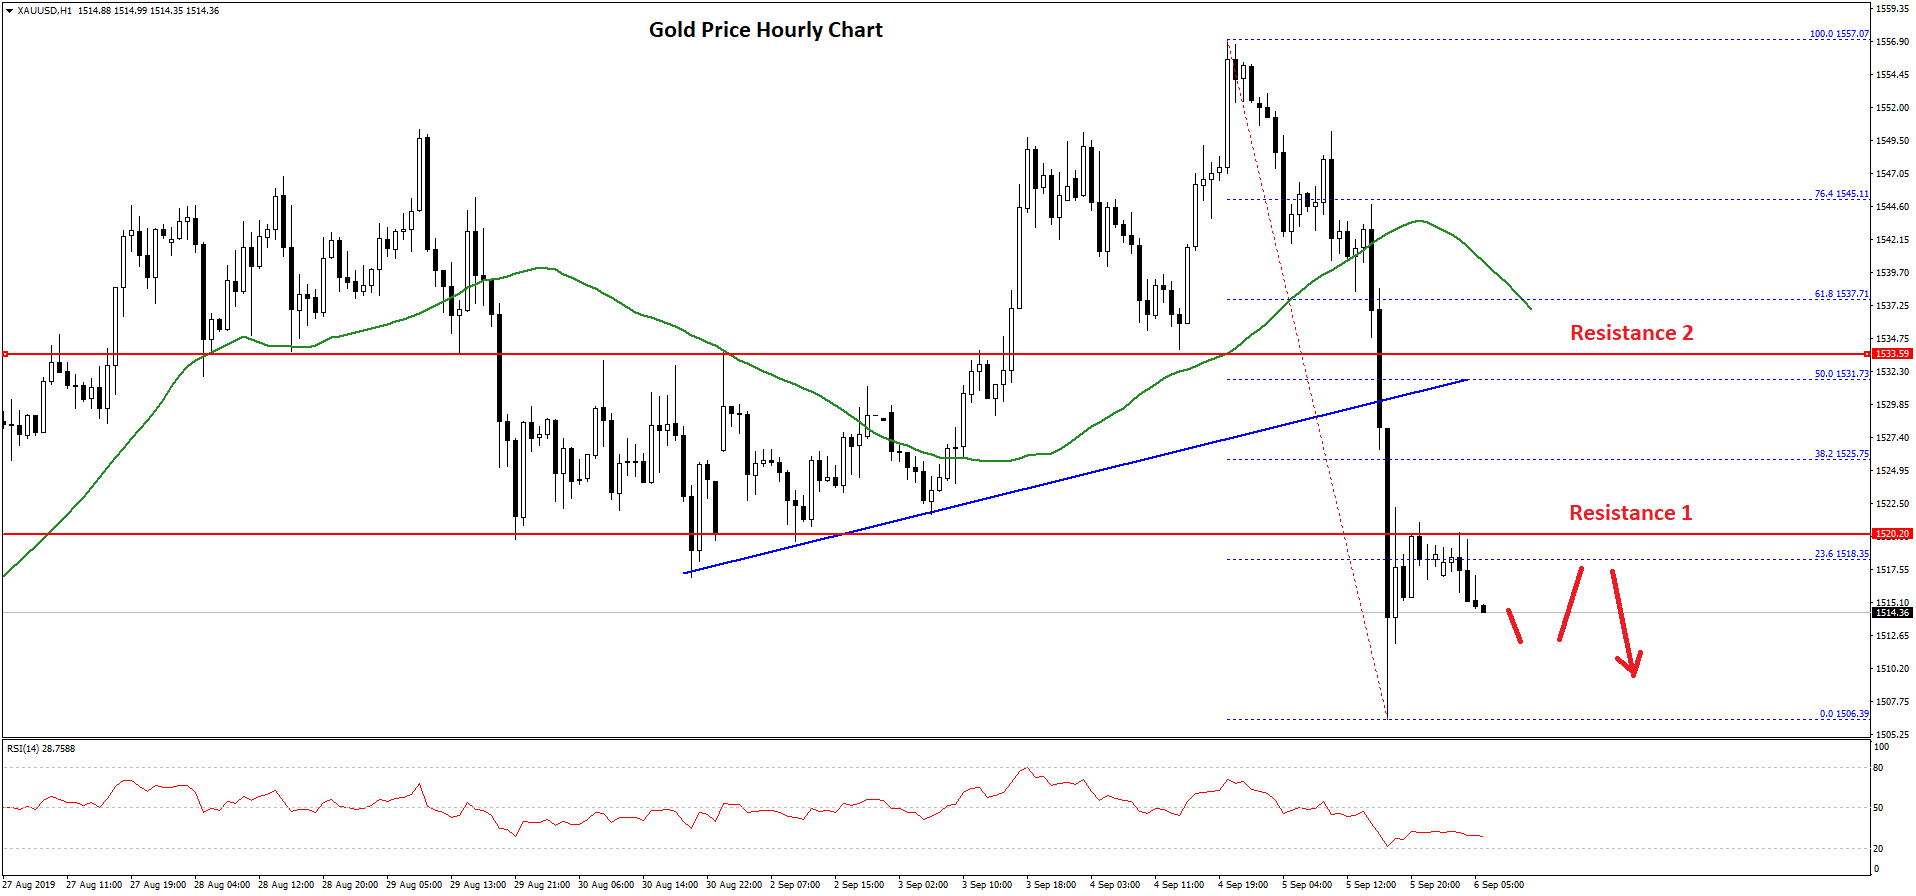
It tested the $1,520 resistance and the 23.6% Fib retracement level of the recent decline from the $1,557 high to $1,506 low. However, the upward move seems to be capped near $1,520.
The price is currently trading with a bearish angle below the $1,515 level. An immediate support is near the $1,510 level, below which the price could revisit the $1,505 and $1,500 support levels.
On the upside, a break above the $1,520 resistance might start a decent recovery towards the $1,530 level. The 50% Fib retracement level of the recent decline from the $1,557 high to $1,506 low is also near $1,530 to act as a resistance.
Overall, gold price remains at a risk of more downsides towards $1,500 as long as it is trading below the $1,520 level.
Oil Price Technical Analysis
There was a fresh increase in crude oil price from the $52.67 swing low against the US Dollar. The price traded above the $53.80 and $54.00 resistance levels to move into a positive zone.
Moreover, there was a close above the $55.00 pivot level and the 50 hourly simple moving average. There was a break above a major bearish trend line with resistance near $55.55 on the hourly chart of XTI/USD.
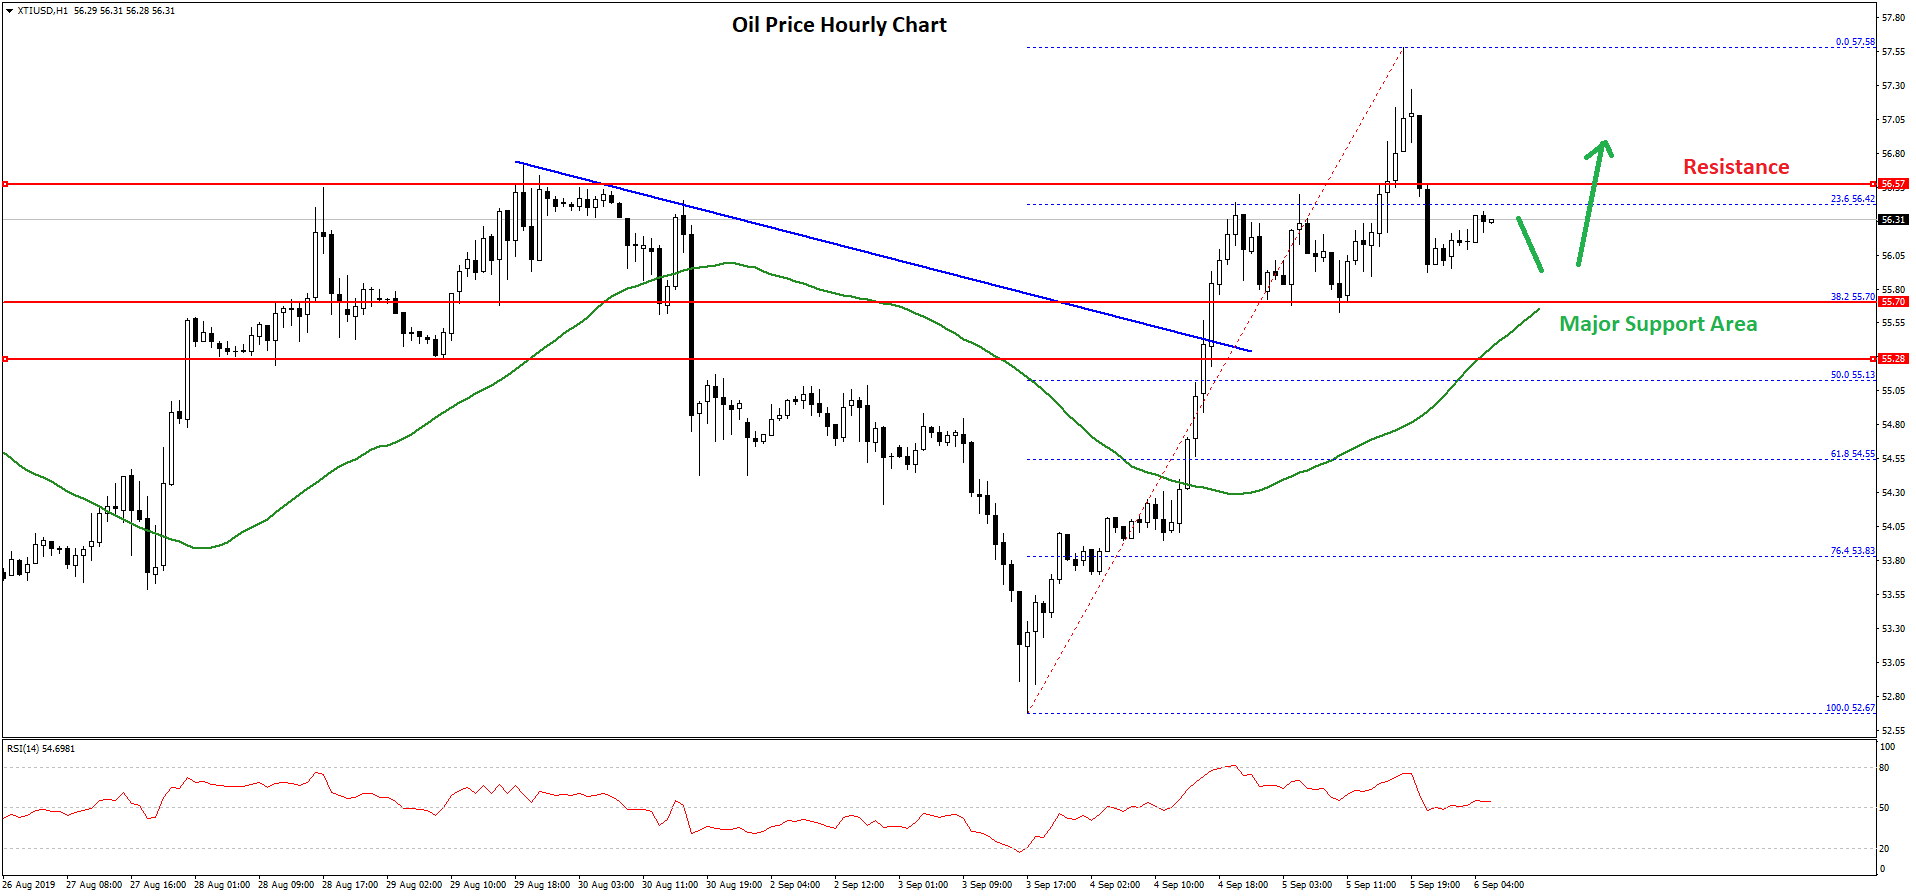
Finally, the price climbed above $56.00 and traded to a new monthly high at $57.58. Recently, the price corrected lower below the $57.00 level and the 23.6% Fib retracement level of the upward move from the $52.67 low to $57.58 high.
However, there are many supports on the downside near the $55.80 and $55.25 levels. The 50% Fib retracement level of the upward move from the $52.67 low to $57.58 high is also near the $55.13 level.
Therefore, the price is likely to climb higher again as long as it is trading above the $50.00 support level. Conversely, a close below the $55.00 support and the 50 hourly simple moving average could start an extended decline in the near term.
The next key support is near the $53.80, where crude oil price might find a strong buying interest. On the upside, the main resistances are near $57.00 and $57.50.
Trade over 50 forex markets 24 hours a day with FXOpen. Take advantage of low commissions, deep liquidity, and spreads from 0.0 pips. Open your FXOpen account now or learn more about trading forex with FXOpen.
This article represents the opinion of the Companies operating under the FXOpen brand only. It is not to be construed as an offer, solicitation, or recommendation with respect to products and services provided by the Companies operating under the FXOpen brand, nor is it to be considered financial advice.
Stay ahead of the market!
Subscribe now to our mailing list and receive the latest market news and insights delivered directly to your inbox.

Latest from Forex Analysis
Latest articles

Weekly Market Wrap With Gary Thomson: Nasdaq, EUR/USD, USD/CHF, Brent Crude Oil, Googl Shares
Get the latest scoop on the week's hottest headlines, all in one convenient video. Join Gary Thomson, the COO of FXOpen UK, as he breaks down the most significant news reports and shares his expert insights.
- Nasdaq Composite: Worst Session

Analysis of AUD/USD: Exchange Rate Falls to Early May Low
As indicated by the 4-hour AUD/USD chart today:
→ the rate fell below 0.652, a level last seen on May 2;
→ the RSI indicator dropped below 15, a level last seen during the panic over the spread of COVID-19

Analysis of AMZN Stock: Price at 1.5-Month Low
As shown in the AMZN chart, the stock price dropped below:
→ the psychological level of $180;
→ the mid-June interim low.
The last time AMZN traded below $180 was in early June.
Thus, AMZN has faced sell-offs, similar to other tech