


Gold Regains $1,800 On Inflation Fears. What’s Next?
FXOpen

Gold has spent the year consolidating. But, curiously enough for market participants, all this time, inflation has been on the rise in the advanced economies all this time.
Most recently, inflation reached levels not seen in decades, running hot in the United States and Europe, two regions where central banks have a hard time generating inflation according to their price stability mandate. But despite the ongoing rise in the prices of goods and services, gold, a traditional hedge against inflation, is powerless. Just the opposite, one may say: it has traded with a bearish tone all year. However, it found important support in the $1,680 area where buyers stepped in.
Last month, gold gained +1.5%, but still ended October down by a little over -6%. Gold equities rallied last month, up by more than +7%, and yet, for the year, they are down close to -12%.
One explanation for gold-related equities and gold’s poor performance is the US dollar index. By the end of October, the dollar index was up by +4.65% on the year, putting pressure on the price of gold.
This is another oddity because the dollar gained while inflation rose, and typically things work the other way around. What will the rest of the trading year bring for gold?
Technical Picture Remains Bullish
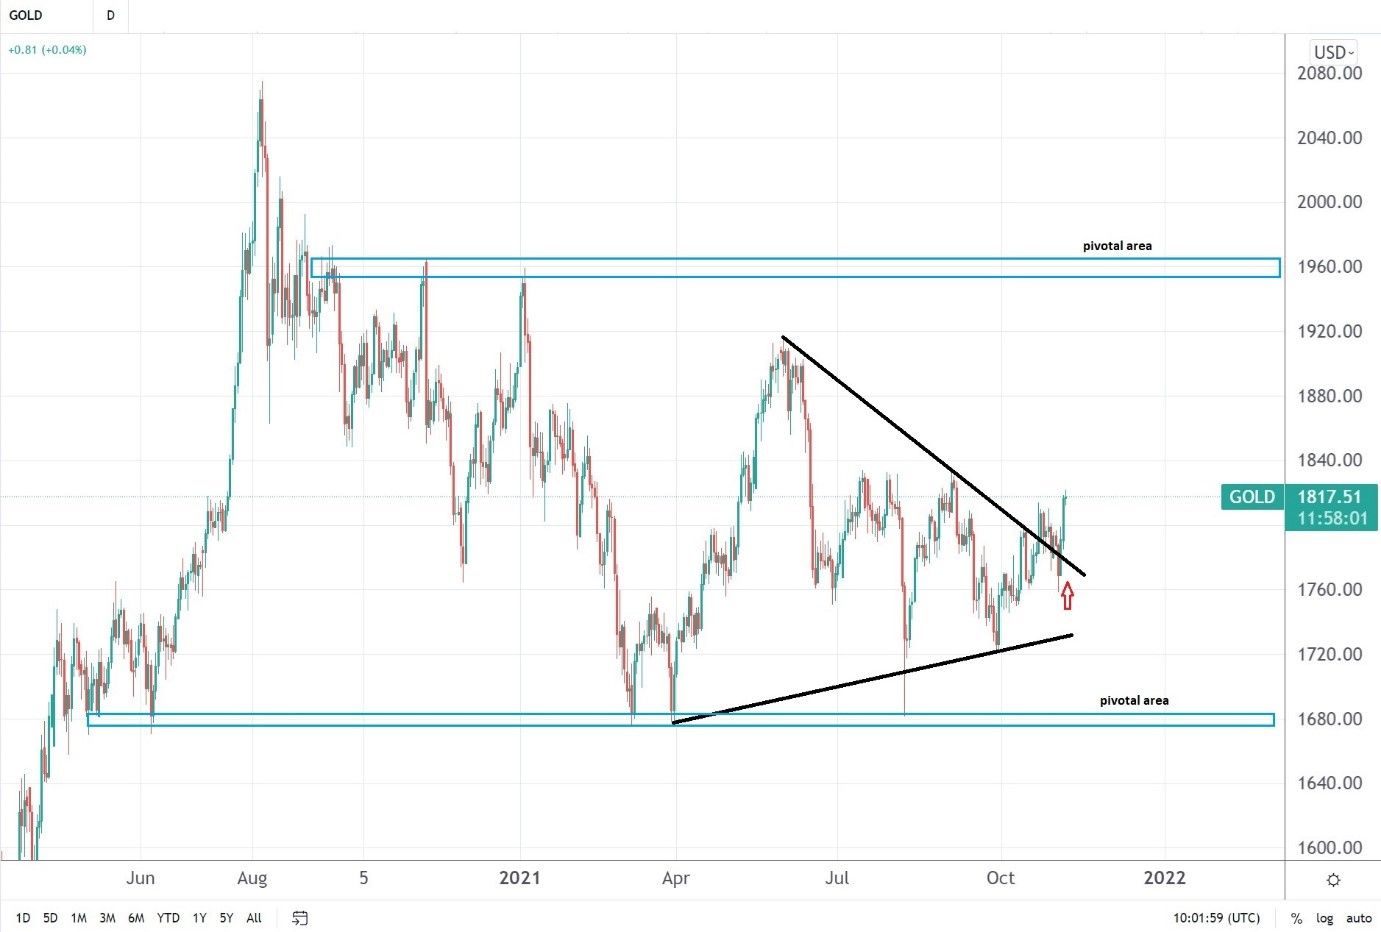
From a technical analysis perspective, the price of gold remains bullish. Two pivotal areas should be mentioned here.
On the one hand, in 2021, the price found strong support at the $1,680 level and has since bounced three times from. On the other hand, the $1,960 is a pivotal area on any move higher. While in between, the price of gold continues to consolidate.
However, judging by the triangular consolidation that just ended, the recent move higher above the upper edge of the triangle indicates more strength ahead. On a daily close above $1,850, traders will push for another run to $1,900.
One thing is clear. If inflation does not cool down in the months ahead, gold will have a hard time remaining at the current level. As such, traders should focus on the bigger picture and adjust their positions accordingly.
This article represents the opinion of the Companies operating under the FXOpen brand only. It is not to be construed as an offer, solicitation, or recommendation with respect to products and services provided by the Companies operating under the FXOpen brand, nor is it to be considered financial advice.
Stay ahead of the market!
Subscribe now to our mailing list and receive the latest market news and insights delivered directly to your inbox.


Latest articles

Analytical Tesla Stock Price Predictions for 2026–2030
Tesla (TSLA) is
European Currencies Seek Stability Amid Rising Geopolitical Tensions
European currencies are showing mixed performance as they attempt to stabilise following their recent decline and the release of the Federal Reserve's latest meeting minutes. The minutes revealed growing concern over persistent inflationary pressures, with several policymakers supporting the possibility
Netflix: Attempting to Break the Short-Term Downtrend
Netflix is preparing to release its financial results for the second quarter of 2026. According to the company's official press release published on 15 June, the earnings report will be released on 16 July, followed by a video interview with