


Gold Remains in Uptrend, Oil Could Continue Lower
FXOpen
Gold price is trading nicely above the $1,210 support with a bullish bias. However, crude oil price is trading lower and upsides are likely to be capped near $72.00.
Important Takeaways for Gold and Oil
- Gold price gained traction recently and traded above the $1,224 resistance against the US Dollar.
- There is a short-term bullish flag pattern forming with resistance at $1,222 on the hourly chart of gold.
- Crude oil price declined recently and traded below the $72.00 and $71.20 support levels.
- There is a bearish trend line in place with resistance at $71.40 on the hourly chart of XTI/USD.
Gold Price Technical Analysis
Gold price started a nice upside move after forming a base near the $1,184-1,185 zone against the US Dollar. The price traded higher and broke the $1,200, $1,205 and $1,220 resistance levels.
The upside move was strong as the price even traded above the $1,224 resistance and settled above the 50 hourly simple moving average. The price formed a high at $1,226 and later started consolidating in a range.
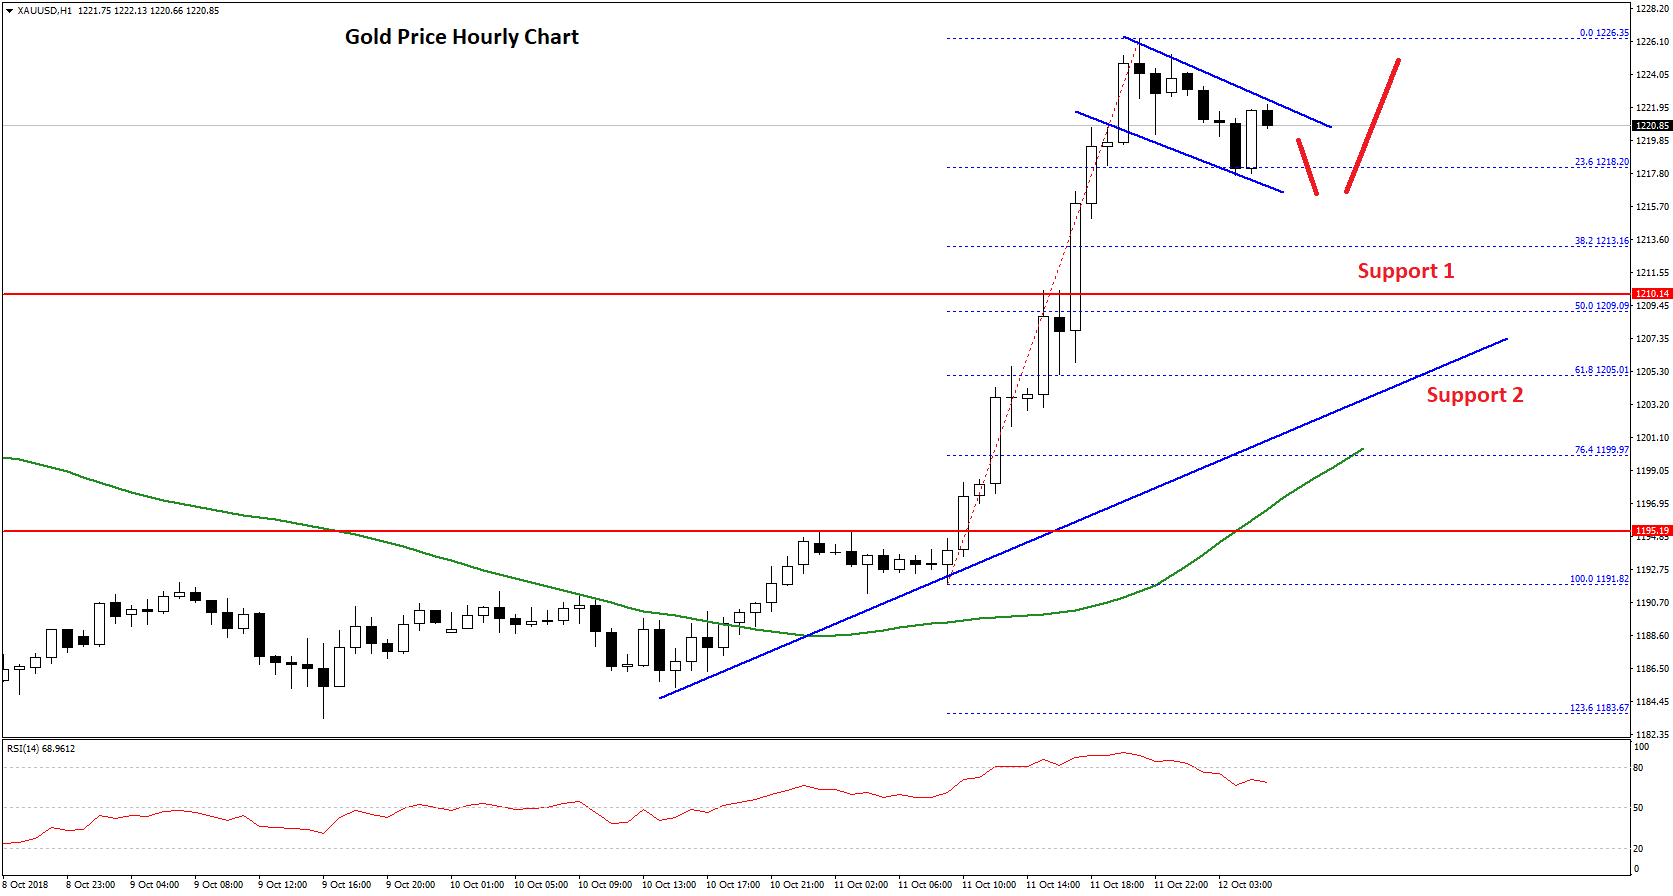
At the moment, it seems like there is a short-term bullish flag pattern forming with resistance at $1,222 on the hourly chart of gold. The price recently tested the 23.6% Fib retracement level of the last wave from the $1,191 low to $1,226 high.
In the short term, there could be a couple of swing moves below $1,225, but the overall price action is positive. On the upside, a break above the $1,225 and $1,226 resistance levels could open the doors for more gains towards the $1,230 level.
On the downside, below $1,218, the next major support is near the $1,210 level. It also coincides with the 50% Fib retracement level of the last wave from the $1,191 low to $1,226 high.
Overall, the price remains well positioned for more gains as long as the price is above the $1,210 support area.
Oil Price Technical Analysis
Crude oil price formed a major top near the $77.00-78.00 zone against the US Dollar. The price started a major downside correction and declined below the $75.00 and $74.20 support levels.
The downside move was strong as the price broke the $72.00 support and settled below the 50 hourly simple moving average. The decline was such that the price traded close to the $70.00 level.
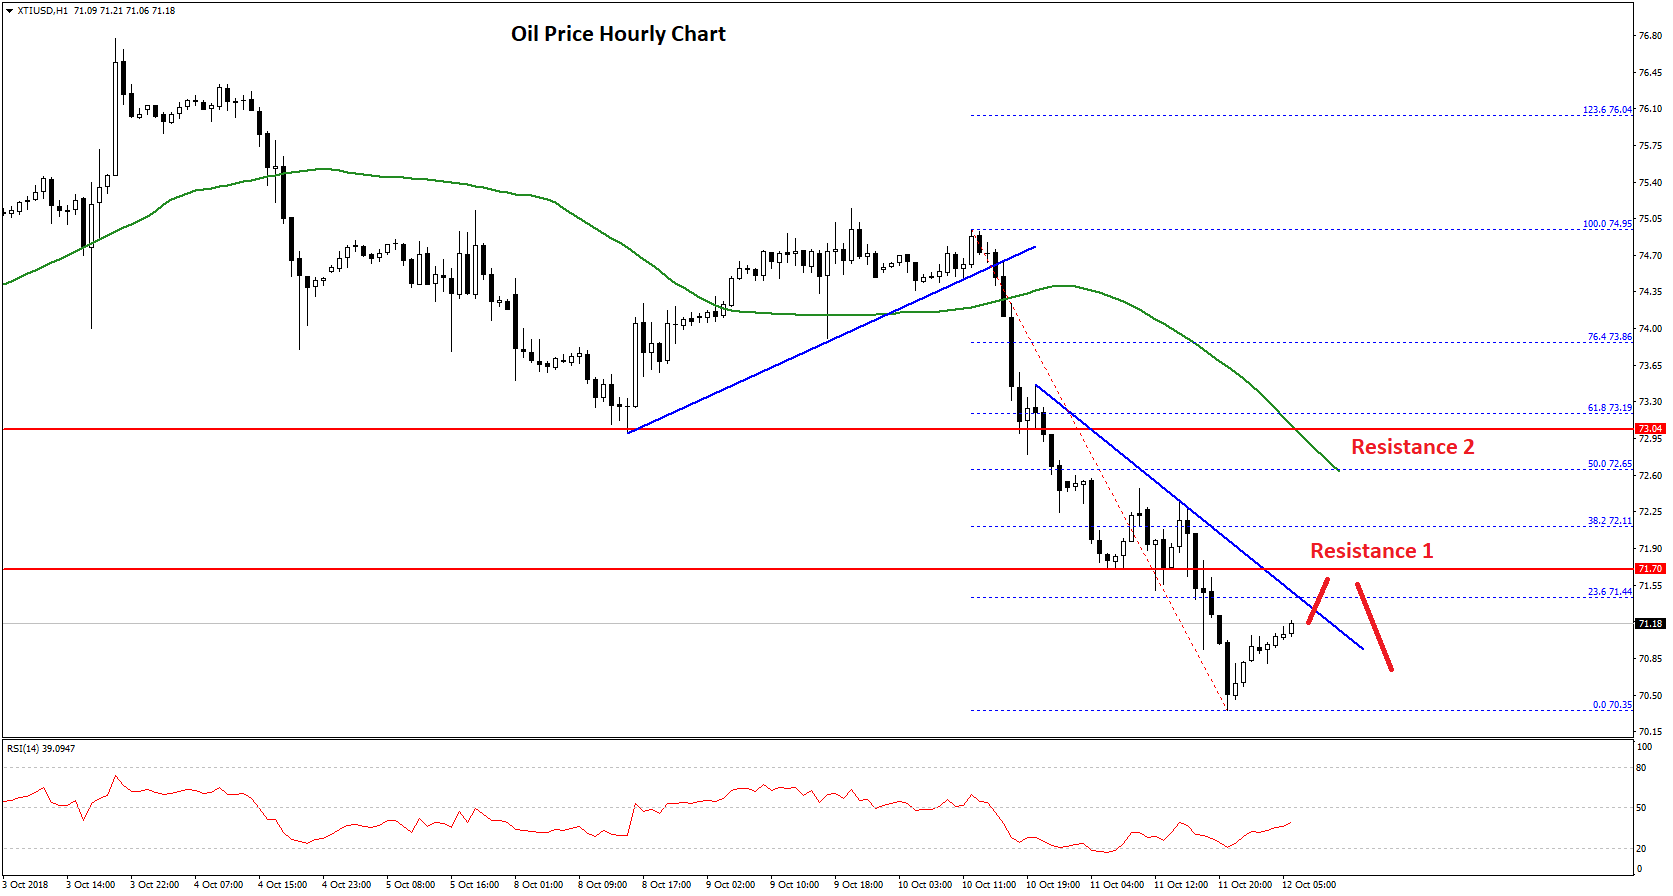
A low was formed at $70.35 and the price is currently correcting higher. An initial resistance is close to the 23.6% Fib retracement level of the recent decline from the $74.95 high to $70.35 low.
Moreover, there is a bearish trend line in place with resistance at $71.40 on the hourly chart of XTI/USD. Above the trend line resistance, the price may test the $71.70 resistance. The most important resistance for buyers is near the $72.50 level.
Moreover, the 50% Fib retracement level of the recent decline from the $74.95 high to $70.35 low is also around the $72.50-60 zone. Therefore, if the price continues to correct higher, it could face a lot of selling pressure near the $72.00 and $72.50 levels.
On the downside, the recent low of $70.35 is a short term support, below which the price could break the $70.00 support to move further into the bearish zone.
Trade over 50 forex markets 24 hours a day with FXOpen. Take advantage of low commissions, deep liquidity, and spreads from 0.0 pips (additional fees may apply). Open your FXOpen account now or learn more about trading forex with FXOpen.
This article represents the opinion of the Companies operating under the FXOpen brand only. It is not to be construed as an offer, solicitation, or recommendation with respect to products and services provided by the Companies operating under the FXOpen brand, nor is it to be considered financial advice.
Stay ahead of the market!
Subscribe now to our mailing list and receive the latest market news and insights delivered directly to your inbox.


Latest articles

Apple: Earnings Day Above the Activity Zone
On 30 April, after the market close, Apple Inc. will release its financial results for the second quarter of fiscal 2026. The consensus forecast, based on estimates from 31 analysts, points to revenue of around $109.7 billion, with expected

USD/JPY and USD/CHF Near Key Levels: The Dollar Supported by the Fed
The US dollar continues to trend upwards following the Federal Reserve meeting, drawing support from the regulator’s moderately hawkish stance and comments by Jerome Powell. Markets interpret the Fed’s rhetoric as a signal that restrictive policy is likely

EUR/USD and GBP/USD consolidate ahead of the Fed decision
European currencies are showing subdued dynamics, entering a consolidation phase following their previous advance. Earlier, EUR/USD and GBP/USD broke out of their ranges and strengthened; however, the subsequent correction has led both pairs to retest the previously breached