


Gold Remains Sell and Oil Buy On Dips
FXOpen
Gold price faced a solid resistance near $1,250 and recently declined. Crude oil price is placed nicely above the $52.00 support area and it could move higher in the short term.
Important Takeaways for Gold and Oil
- Gold price topped near the $1,250 level recently and started a downside correction against the US Dollar.
- There is a major bearish trend line formed with resistance at $1,245 on the hourly chart of gold.
- Crude oil price settled above the key $52 support area with positive signs.
- There is a major bearish trend line formed with resistance at $53.80 on the hourly chart of XTI/USD.
Gold Price Technical Analysis
Gold price gained bullish momentum this past week and traded above the $1,235 and $1,240 resistance levels against the US Dollar. The price even broke the $1,248 resistance and tested the $1,250 barrier.
Sellers appeared near the $1,250 level and protected further gains. A high was formed close to the $1,251 level and later the price started a downside move. The price declined below the $1,246 level and settled below the 50 hourly simple moving average.
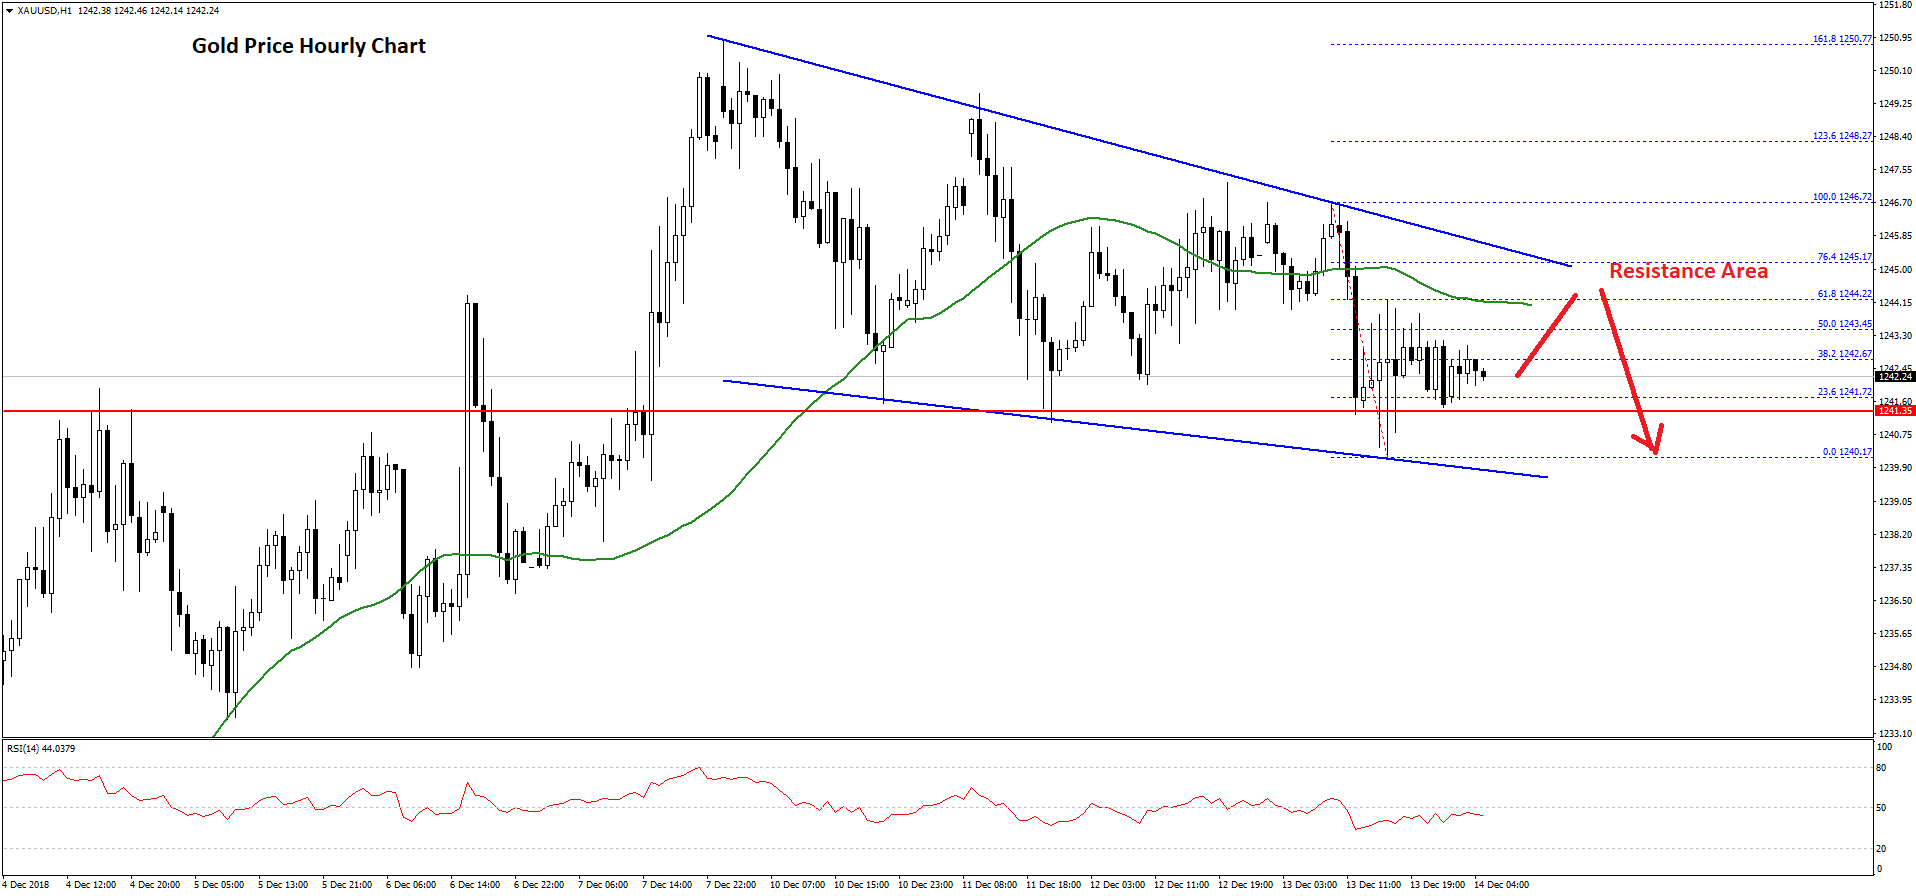
A low was formed near $1,240 on FXOpen before the price started an upside correction. It moved above the 23.6% Fib retracement level of the last decline from the $1,246 low to $1,240 high.
However, the upside move was capped by the $1,244 level and the 50 SMA. Moreover, the 50% Fib retracement level of the last decline from the $1,246 low to $1,240 high also acted as a resistance.
More importantly, there is a major bearish trend line formed with resistance at $1,245 on the hourly chart of gold. Therefore, if the price corrects higher, it is likely to face a lot of sellers near the $1,244 and $1,245 resistance levels.
On the downside, the $1,240 level is an initial support, below which the price may perhaps test the $1,236 support area in the near term.
Oil Price Technical Analysis
Crude oil price formed a solid support base near the $50.50 level and later started an upward move against the US Dollar. The price traded higher and broke the $51.00 and $51.50 resistance levels.
The upside move was positive as there was a close above the $52.00 resistance and the 50 hourly simple moving average. It opened the doors for more gains and the price recently traded towards the $53.50 level and formed a high at $53.42.
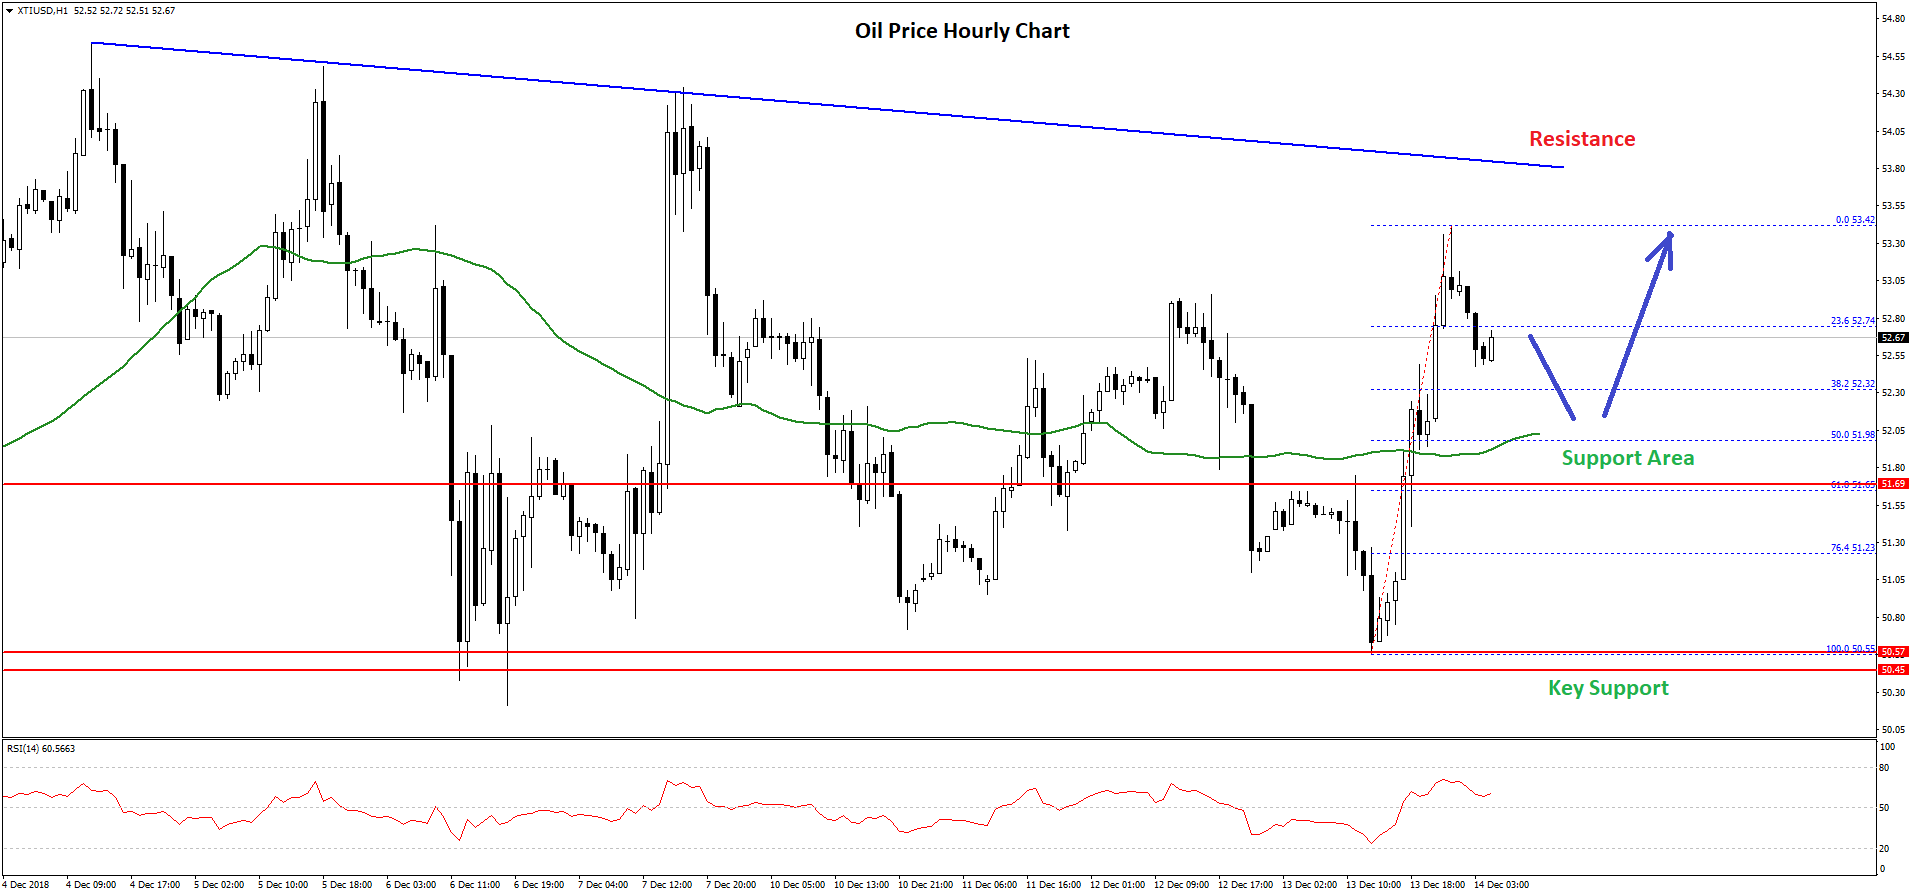
Later, there was a downside correction and the price moved below the 23.6% Fib retracement level of the recent wave from the $50.55 low to $53.42 high. However, there is a strong support formed near the $52.00 level and the 50 hourly SMA.
Moreover, the 50% Fib retracement level of the recent wave from the $50.55 low to $53.42 high is also near $52.00 to act as a support. Therefore, if the price corrects lower from the current levels, buyers are likely to protect losses below the $52.00 support.
On the upside, the $53.50 level is an initial resistance. The main resistance is near $54.00 and a major bearish trend line formed with resistance at $53.80 on the hourly chart of XTI/USD. Therefore, it won’t be easy for buyers to clear the $54.00 resistance in the near term.
Trade over 50 forex markets 24 hours a day with FXOpen. Take advantage of low commissions, deep liquidity, and spreads from 0.0 pips (additional fees may apply). Open your FXOpen account now or learn more about trading forex with FXOpen.
This article represents the opinion of the Companies operating under the FXOpen brand only. It is not to be construed as an offer, solicitation, or recommendation with respect to products and services provided by the Companies operating under the FXOpen brand, nor is it to be considered financial advice.
Stay ahead of the market!
Subscribe now to our mailing list and receive the latest market news and insights delivered directly to your inbox.


Latest articles

DAX 40: consolidation amid technology sell-off
A wave of selling in the technology sector that emerged earlier this week has weighed on European equities. The trigger was investor concern over the profitability of large-scale debt-funded investments by major US tech companies in AI infrastructure. The Nasdaq

Euro Hits Fresh Yearly Lows Amid Dovish ECB Signals
The euro remains under pressure following weak macroeconomic data from the euro area and fresh signals that the European Central Bank is prepared to maintain a more accommodative monetary policy stance. Data released yesterday pointed to a deterioration in business

Pound at Key Levels: Markets Assess Impact of Political Uncertainty in the UK
The British pound remains under pressure following increased political uncertainty in the United Kingdom triggered by the Prime Minister’s resignation. Investors are assessing potential shifts in the political and economic policy outlook after the head of government stepped down,