


FXOpen
The price of gold extended upside movement on Monday, increasing the value of yellow metal to more than $1115 an ounce following the release of some key economic news from China. The technical bias remains bullish because of a Higher Low (HL) in the recent downside move.
Technical Analysis
As of this writing, the yellow metal is being traded around $1121. A hurdle can be noted near $1127, the swing high of the last major upside rally as demonstrated in our four-hour timeframe. A break above $1127 will confirm the bullish trend, validating a move towards the $1150 an ounce.
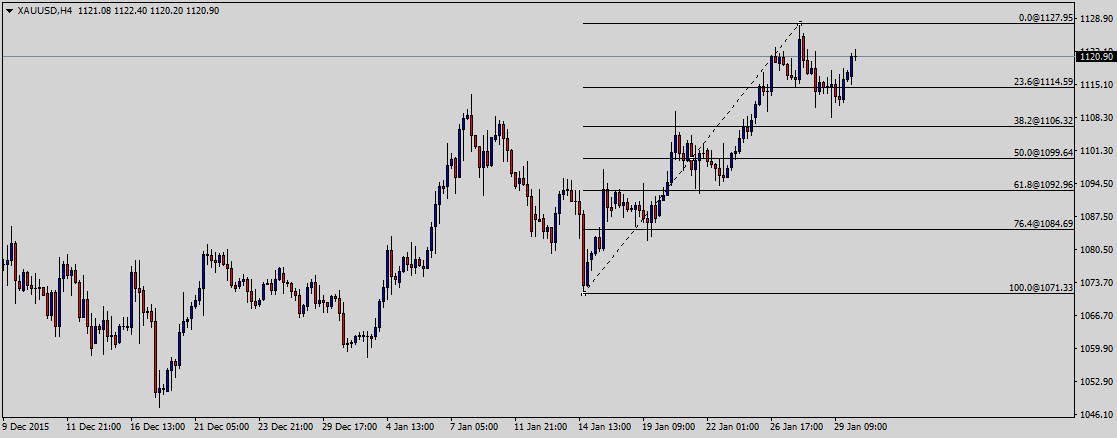
On the downside, the precious metal is expected to find a support around $1114, the 23.6% fib level ahead of $1100, the 50% fib level and then $1092, the swing low of the last major downside move. The technical bias will remain bullish as long as the $1108 support area is intact.
China’s Manufacturing Activity
Official factory activity in China, the largest buyer of gold, skidded to a three-year low point in January, adding to further gloom about the state of the world’s second-largest economy. The government-compiled January manufacturing purchasing manager’s index (PMI) came in at 49.4, slightly missing Reuters consensus estimates for a 49.6 reading and ticking down from December’s 49.7 figure. It was the weakest result since 2012 and marked the sixth straight month in contraction territory.
The mood was worsened by a private survey by Caixin and Markit that showed January manufacturing activity shrinking for the eleventh straight month. Caixin’s survey, which tracks smaller firms than the official indicator, came in at 48.4, compared to December’s reading of 48.2. A score below 50 indicates a contraction in the sector, while one above 50 means expansion.
Trade Idea
Considering the overall technical and fundamental outlook, selling the precious metal above $1127 could be a good strategy if we get a valid bearish reversal candle.
Trade over 50 forex markets 24 hours a day with FXOpen. Take advantage of low commissions, deep liquidity, and spreads from 0.0 pips. Open your FXOpen account now or learn more about trading forex with FXOpen.
This article represents the opinion of the Companies operating under the FXOpen brand only. It is not to be construed as an offer, solicitation, or recommendation with respect to products and services provided by the Companies operating under the FXOpen brand, nor is it to be considered financial advice.
Stay ahead of the market!
Subscribe now to our mailing list and receive the latest market news and insights delivered directly to your inbox.


Latest articles

XBR/USD Chart Analysis: Price Rebounds from a Seven-Week Low
On 1 December, we outlined a descending channel on the XBR/USD chart and noted that the bearish trend was driven by fading geopolitical risks. Indeed, hopes for an end to the war in Ukraine—along with the possibility of

Silver Price Hits Historic Record Around $64
On 27 November, we suggested that silver was preparing to challenge its all-time high. Since then (marked with the orange arrow), XAG/USD has risen by roughly 18%, breaking above the psychological $60-per-ounce threshold for the first time in history.