


Hanging Man vs Hammer: What Is the Difference?
FXOpen
Candlestick patterns reveal how buyers and sellers interact within a single session, often hinting at potential turning points. The hammer and hanging man patterns look identical but tell completely different stories depending on where they appear. This article explains the difference between hammer and hanging man candlesticks, their structure, and how they’re traded.
The Hammer Pattern Explained
A hammer is one of the visual signs that selling pressure is weakening. It forms after a decline and has a small real body near the top of the candle, a long lower shadow, and little to no upper wick. The long shadow shows that sellers drove the price down during the session, but buyers managed to push it back up before the close—a sign that downside momentum may be fading.
For the pattern to count as a hammer, the lower shadow is usually at least twice the height of the body. The candle can be any colour, but a green or bullish hammer often reflects stronger buying interest by the end of the session.
Some traders mistakenly refer to a hammer forming mid-trend as a reversal candlestick, but that’s inaccurate. The hammer only signals potential reversal when it appears after a clear decline.
Traders look for hammers near key support levels or after a clear downtrend because the context tells the story: buyers are stepping in where sellers are running out of strength. A single hammer doesn’t reverse a market on its own, but it signals that sentiment could be shifting.
Research backs up this interpretation. In his book, Encyclopedia of Candlestick Charts, Thomas Bulkowski found that confirmed hammer formations led to bullish reversals roughly 60% of the time on daily charts. While that doesn’t guarantee a reversal, it shows why traders pay attention when a hammer appears after sustained selling pressure—especially if the next candle closes higher, confirming the change in momentum.

The Hanging Man Pattern Explained
A hanging man looks identical to a hammer—a small real body near the top, a long lower shadow, and little or no upper wick. However, instead of appearing after a decline, it develops after an uptrend, often near resistance or after a strong rally, and signals an uptrend reversal. A hanging man in a downtrend is just a hammer.
Overall, it tells a very different story. During the session, buyers initially push prices higher, continuing the trend. But sellers then drive prices sharply lower before buyers manage to lift them back near the open. That long lower shadow shows that selling pressure suddenly entered the market. Even though the price closed near its opening level, the intraday weakness hints that buyers might be losing control.
A hanging man doesn’t confirm a reversal on its own, but it warns that bullish momentum could be fading. If the next candle closes below the hanging man’s body, that confirms sellers are following through.
According to Bulkowski’s research, confirmed hanging man setups lead to bearish reversals around 55% of the time on daily charts. That’s not overwhelming, but it’s significant enough that traders watch for them closely, especially when markets start showing hesitation after a strong climb.
Hammer vs Hanging Man: The Core Difference
At first glance, the hammer and hanging man patterns are identical—same shape and same proportions. The main difference lies in where they appear and what that context implies.
A hammer develops after a decline, hinting that sellers are losing momentum and buyers are starting to step in. A hanging man forms after an advance, warning that buyers are tiring and selling pressure is emerging. In other words, one suggests the potential start of a bullish phase, while the other hints at the possible end of one.
The reason context matters is because candlestick patterns don’t exist in isolation. A hammer at the bottom of a sell-off reflects capitulation; a hanging man at the top of a rally reflects hesitation. The same shape, viewed through the lens of the trend, flips meaning entirely.
In both the hanging man and hammer, the psychology is about balance shifting between buyers and sellers. A hammer shows that buyers absorbed heavy selling and pushed prices back up—strength in recovery. A hanging man shows that sellers absorbed strong buying and forced prices lower—weakness behind the surface.
Traders often misread the two by focusing on shape alone. The real insight comes from recognising what phase of the market they appear in. The candle itself doesn’t decide direction; the trend and context do. That’s why traders read both patterns as moments of transition, not signals in isolation.
Hammer vs Hanging Man: Volume, Confirmation, and Context
What happens around these patterns—the volume, the next candle, and the broader market structure —gives them meaning.
Volume
Volume adds weight to any candlestick signal. When a hammer forms with a noticeable increase in trading volume, it shows genuine buying interest stepping in after a decline. The same applies to a hanging man—high volume signals that sellers are becoming active. Low volume, by contrast, often points to hesitation rather than conviction.
Confirmation
Traders look for confirmation from the next candle: a higher close after a hammer or a lower close after a hanging man. This follow-through is what turns a single candle into evidence of shifting sentiment. Without it, the signal remains incomplete and can lead to false expectations if the market continues in its original direction.
Context
Context is what separates meaningful signals from random ones. When comparing a hanging man vs hammer candlestick pattern, it’s important to understand that both patterns gain significance when they form at clear technical levels—such as previous highs, lows, or trendline zones.
A hammer in the middle of a sideways range means little, while one near a long-term support carries more weight. Similarly, a hangman candlestick at an overextended rally often warns that buyers are running out of steam. Structure and placement make all the difference.
Combining Patterns with Technical Tools
Candlestick patterns may become more meaningful when paired with other forms of technical analysis. A hammer or hanging man on its own shows a potential shift in sentiment, but combining it with broader tools may add context and filter out low-quality signals. Traders often use this approach to focus on areas where genuine momentum or exhaustion is building.
Some of the most common tools used alongside these patterns include:
- Support and resistance zones: Mark levels where reversals are statistically more likely to occur.
- Fibonacci retracements: Highlight potential reaction points within existing trends.
- Trendlines: Show whether the pattern coincides with a key breakout or rejection.
- Moving averages: Indicate overall trend direction and strength, confirming whether the pattern aligns with broader momentum.
- RSI (Relative Strength Index): Identifies overbought or oversold conditions that may strengthen a reversal setup.
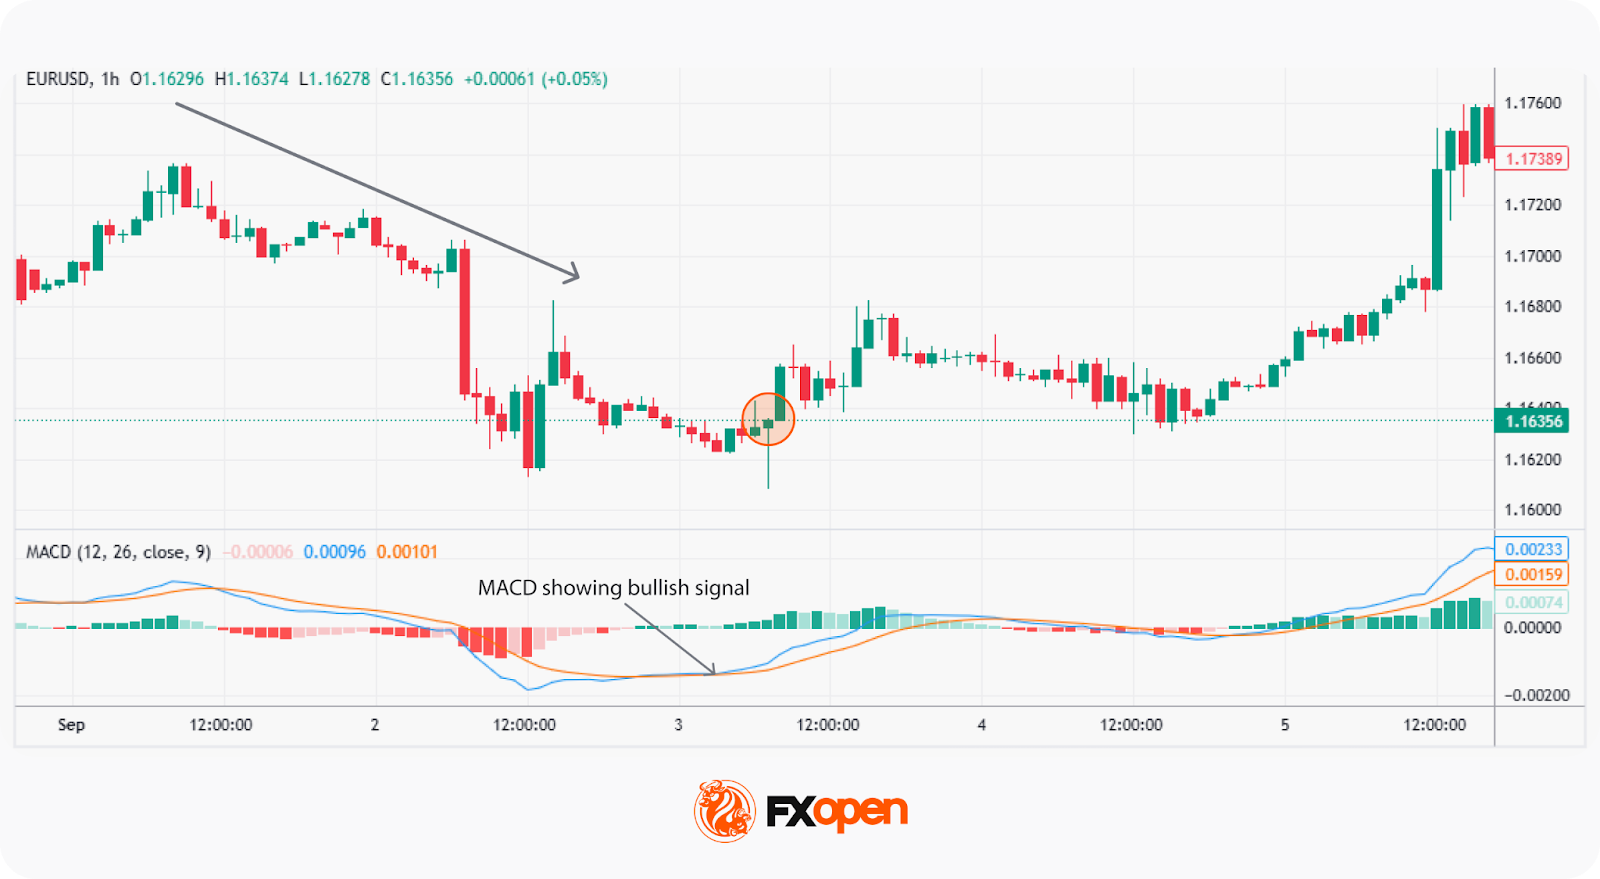
- Moving Average Convergence Divergence (MACD): Confirms momentum changes that align with hammer or hanging man setups.
You can uncover over 1,200 trading tools in FXOpen’s TickTrader platform.
How the Hammer and Hanging Man May Be Traded
Both the hanging man candle vs hammer can signal potential turning points, but reading them properly means following a structured process rather than reacting to the first sign of reversal. Traders typically focus on confirmation, clear invalidation, and defined exit targets.
1. Putting the Pattern in Context
Traders check that the hammer forms after a clear decline or the hanging man after a steady rally. The surrounding candles typically show exhaustion in the prior move rather than random volatility.
2. Assessing the Confluence
Patterns gain strength when they align with other factors—such as key support or resistance, trendline tests, or RSI extremes. Multiple confirming signals might increase the odds of a meaningful move.
3. Waiting for Confirmation
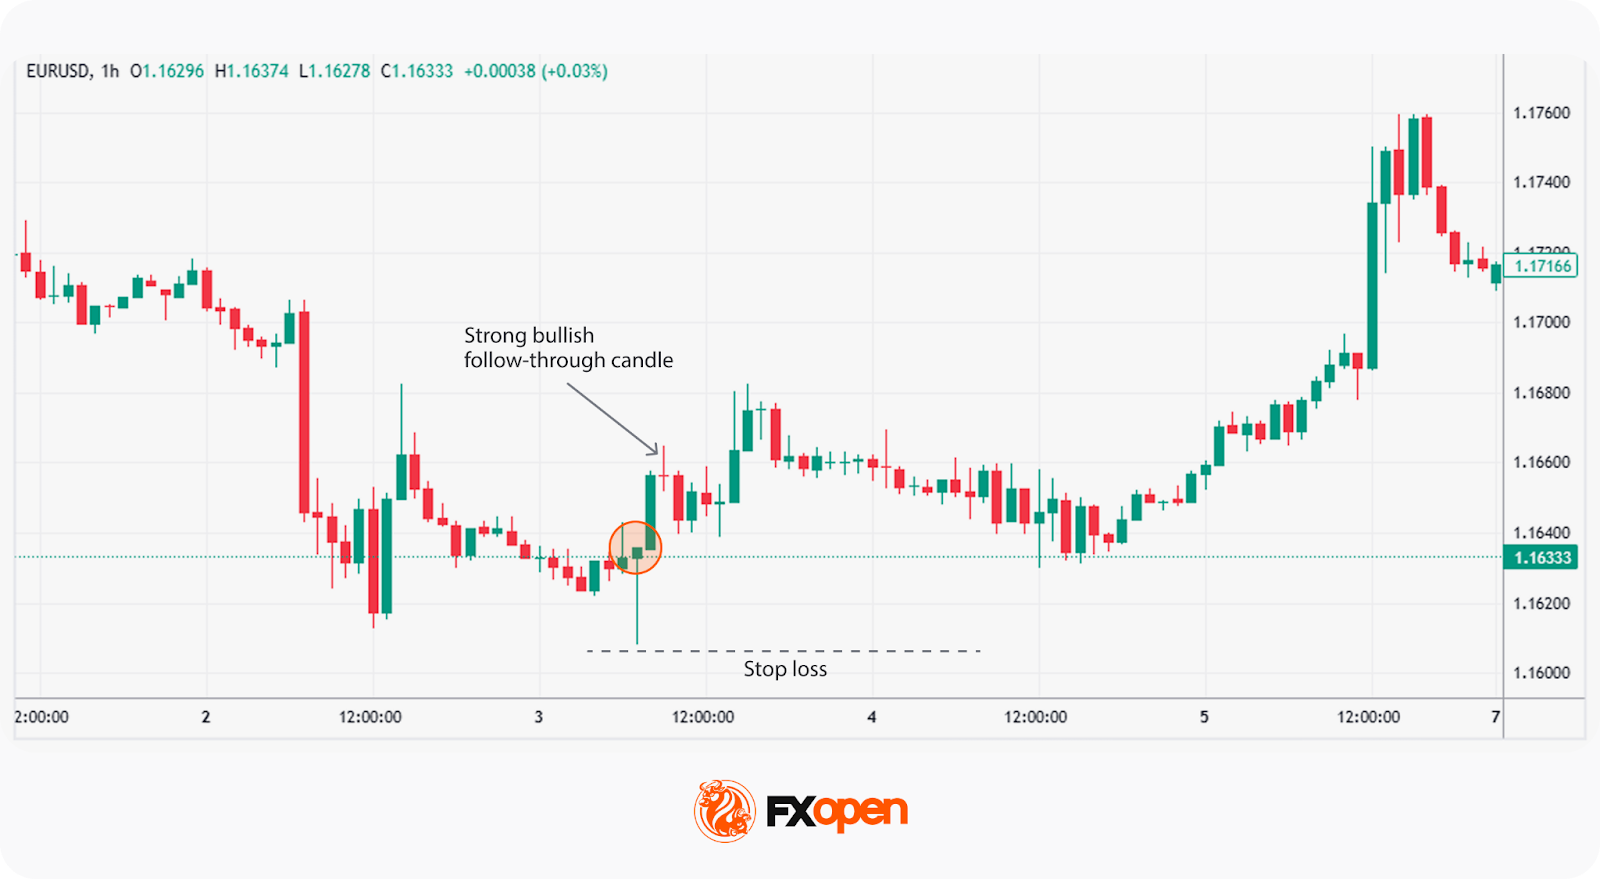
Traders often look for the next candle to close beyond the body of the pattern—above for a hammer, below for a hanging man. This may show that momentum is shifting.
4. Defining Risk
Stop losses are commonly placed just below the hammer’s low or above the hanging man’s high, allowing clear invalidation if price moves against the setup.
5. Setting Realistic Targets
Targets are often based on nearby resistance or support levels, or a 1:3 risk-to-reward ratio. Some traders scale out as price reaches key areas rather than holding for a single exit.
The Bottom Line
Both the hanging man vs hammer candlesticks offer valuable insight into shifts in market sentiment, but their meaning depends entirely on context and confirmation. Recognising where they form and how price reacts next may help traders distinguish genuine reversals from short-term noise. To study these patterns in live market conditions, consider opening an FXOpen account to analyse candlestick behaviour in real time.
FAQ
What Is the Difference Between a Hanging Man and a Hammer Candle?
Both candles have the same shape—a small real body near the top with a long lower shadow—but appear in opposite trends, marking the key difference between the hammer and hanging man. A hammer forms after a decline and can indicate potential bullish reversal, while a hanging man forms after a rally and may warn of weakening bullish momentum. In essence, a hanging man candlestick in a downtrend is simply a hammer, as is a bullish hanging man candlestick.
Is Hanging Man Bullish or Bearish?
The hanging man is generally bearish. It appears after an uptrend, showing that sellers entered the market even as buyers tried to hold control. If the next candle closes lower, it confirms selling strength.
Is the Hammer Pattern Bullish or Bearish?
The hammer is bullish. It usually appears after a downtrend and signals a potential reversal to the upside. The long lower shadow indicates that sellers pushed the price down significantly, but buyers stepped in and drove it back up, showing growing bullish momentum.
This article represents the opinion of the Companies operating under the FXOpen brand only. It is not to be construed as an offer, solicitation, or recommendation with respect to products and services provided by the Companies operating under the FXOpen brand, nor is it to be considered financial advice.
Stay ahead of the market!
Subscribe now to our mailing list and receive the latest market news and insights delivered directly to your inbox.


Latest articles

Pound Weakens After Soft UK Inflation Data as Euro Awaits Fresh Market Signals
The pound remains under pressure following the release of weaker-than-expected UK inflation data. The slowdown in inflation has strengthened expectations that the Bank of England could adopt a more accommodative policy stance in the coming months, weighing on sterling. Meanwhile,

Alphabet: Record Profit as Markets Await Their Verdict
On 22 July, Alphabet reported its Q2 2026 results, with revenue rising 24% year-on-year to $119.8 billion. Google Cloud revenue surged 82% to $24.77 billion, comfortably exceeding analysts' expectations. Search advertising generated $63.3 billion in revenue (+17%

NZD/USD Analysis: A Tug-of-War at the Critical Level
The kiwi has strengthened meaningfully against most peers this month. However, against the US dollar specifically, NZD/USD remains well below its 2026 highs, trading in the mid-0.58 area versus January's peak near 0.6075.
New Zealand's Q2 inflation