


How Bond Spreads Can Help You Trade Forex
FXOpen
In the intricate world of forex trading, bond spreads offer valuable insights into currency movements. By examining the yield differences between bonds, traders can gauge economic health and investor confidence. This article delves into the nuanced relationship between bond spreads and forex, providing practical examples and ways to utilise this information in forex trading.
Bond Spreads Explained
Bond spreads, a term familiar in the world of finance, refers to the difference in yield between two bonds. They provide insight into various economic and market conditions. Government bond spreads are the most important, as they compare the yield of a country's government bonds to a benchmark bond, often seen as a risk-free standard, like US Treasuries. Note that there are other kinds of bond spreads, like high-yield corporate bond spreads, but they’re mostly unrelated as a forex indicator.
To grasp the concept, imagine two countries – Country A and Country B. Country A's government bonds might yield 2%, while Country B's yield 4%. The spread here is 2% (4% - 2%). Such a difference can signal investors' perceptions of risk between these two economies. A wider spread often suggests a higher perceived risk or instability in the country with a greater yield.
Bond spreads today are a dynamic indicator, constantly influenced by economic policies, geopolitical events, and market sentiment. They are essential in gauging economic health and investor confidence.
How Are Bond Spreads and Currencies Related?
Bond spreads and currencies share a significant relationship, which is pivotal for understanding global financial dynamics. The US dollar and bond relationship is a prime example. As the benchmark in many spread calculations, fluctuations in US Treasury yields can heavily influence the value of the dollar. Thus, the bond yields and currency relationship is where changes in a country's bond yields can signal shifts in its currency's strength or weakness.
In the realm of foreign exchange, the bond-currency nexus becomes even more evident. Movements in FX and bonds are interconnected; when yields rise, indicating economic strength or higher interest rates, the associated currency often appreciates. Conversely, falling yields can suggest economic challenges, potentially leading to a weaker currency.
How to Use Bond Spreads as a Leading Forex Indicator
To effectively utilise bond spreads as a forex indicator, traders focus on the trend and magnitude of changes in bond yields, particularly in key economies. For instance, European government bond yields offer crucial insights into the Eurozone's economic health. A rising trend in these yields, especially when outpacing other major economies, can signal strengthening economic conditions in Europe, potentially leading to a stronger euro.
Traders compare these trends across different countries. For example, if European yields are rising while US yields remain stagnant or fall, it may indicate a future appreciation of the euro against the US dollar. It's essential to analyse these movements in the context of global economic events and monetary policies over the long term, as they can significantly impact yield trajectories.
Many traders also leverage technical indicators and tools in their approach. Head over to FXOpen’s free TickTrader platform to access over 1,200 of these trading tools.
GBP/USD Example
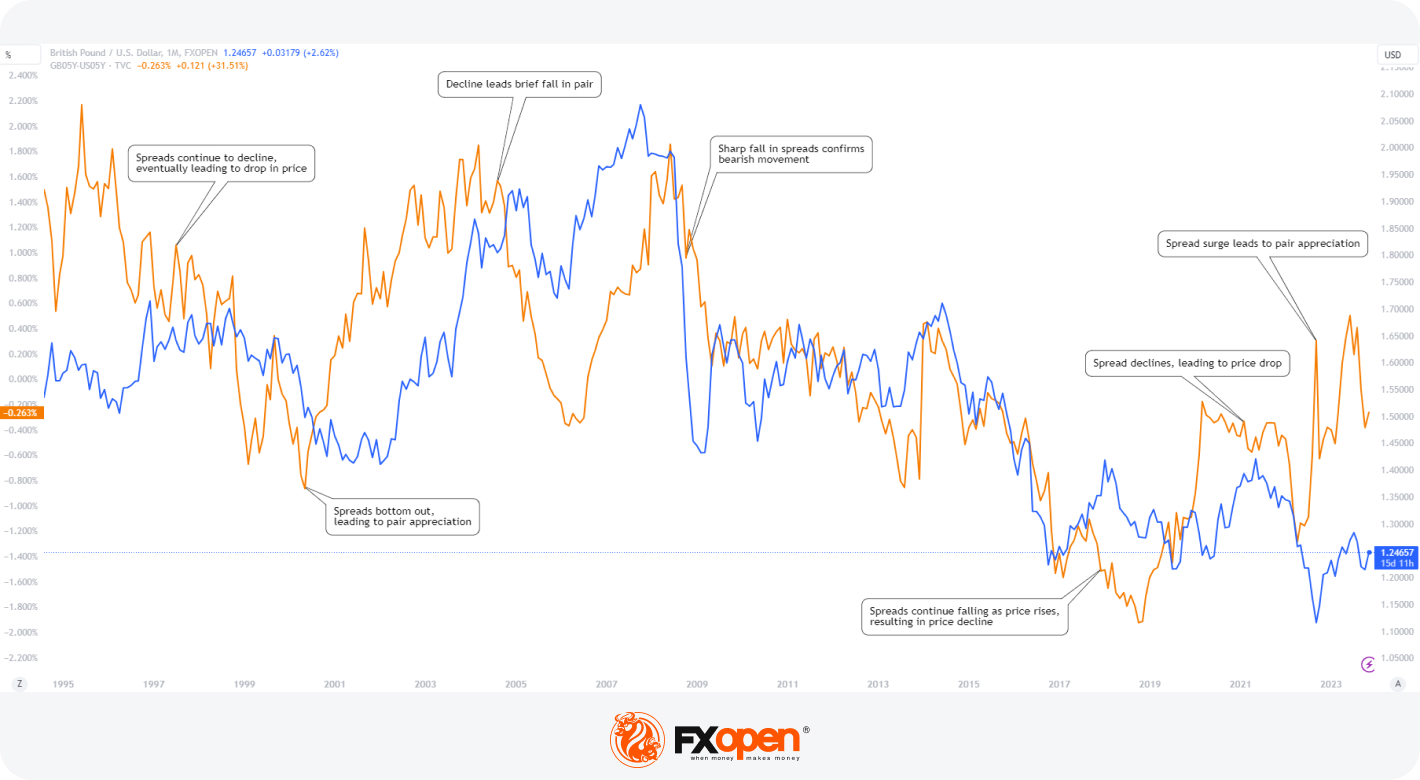
This chart illustrates a compelling correlation between the GBP/USD exchange rate (blue line) and the yield spread between 5-year British and US bonds (orange line). Notably, around 2001, the yield spread hit a low and began to climb, with the GBP/USD pair initially ranging before following the upward trend in late 2002/early 2003. Between 2005 and 2007, a decline in the yield difference preceded a pullback in the GBP/USD pair.
From 2007 to 2017, the spread and the GBP/USD price generally moved in tandem, demonstrating a consistent relationship. However, around 2018, a divergence occurred: while spreads continued to fall, the GBP/USD pair rose, an anomaly that eventually led to a decline in the currency pair. The divergence underscores the importance of closely monitoring such discrepancies for potential market reversals.
In 2019/2020, an increase in bond spreads is observed, with the GBP/USD pair eventually echoing this upward movement. Most recently, in late 2022, a surge in the yield difference has led to bullish momentum in the GBP/USD pair.
AUD/USD Example
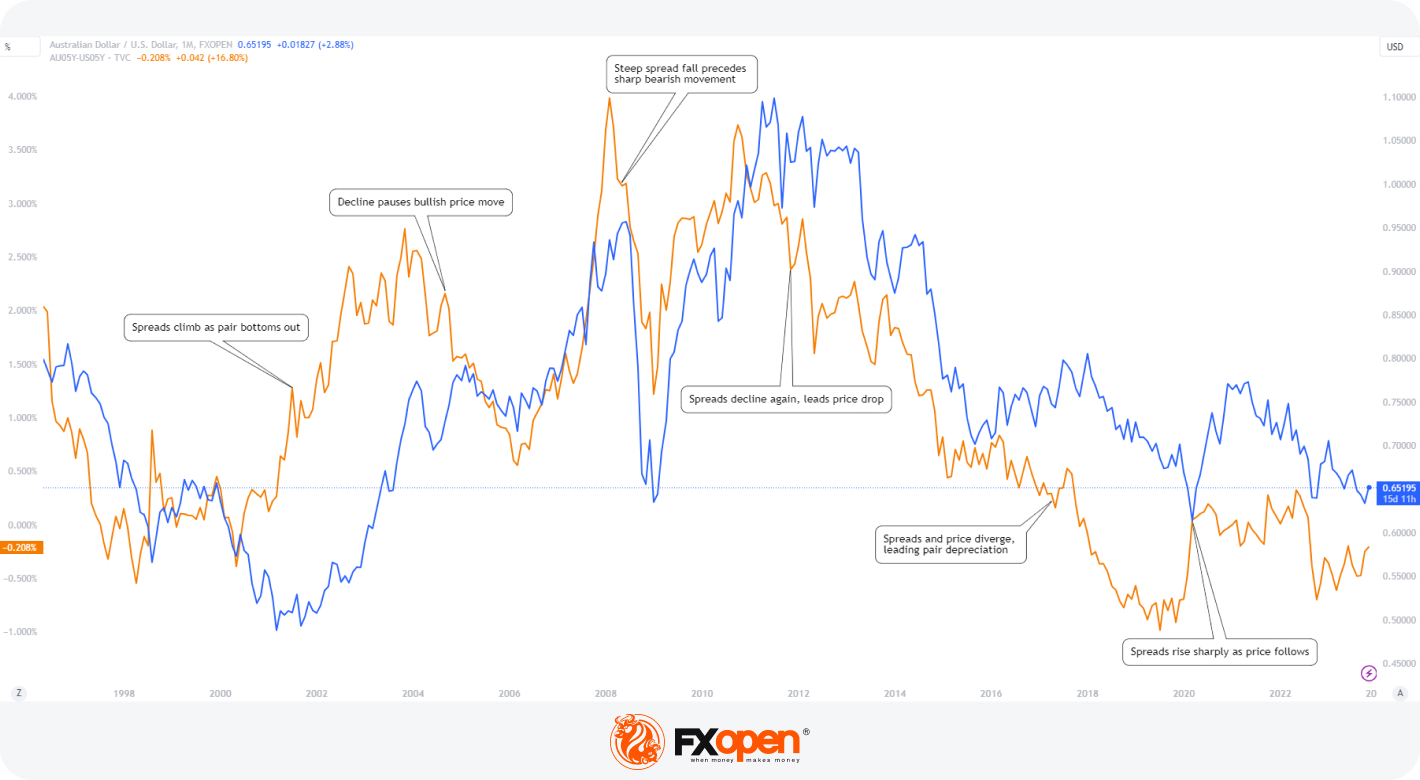
The AUD/USD pair (blue line), alongside the yield spread between Australian and US 5-year bonds (orange line), reveals insightful patterns. Between 2000 and 2002, as bond spreads rose, the AUD/USD pair found its footing and embarked on a significant bullish trajectory.
In 2004, a decrease in spreads coincided with a pause in the AUD/USD's bullish trend, though the currency pair didn't decline sharply, indicating a more nuanced response to bond market signals. The 2008 financial crisis presents a stark example of this relationship: a sharp drop in spreads precedes a dramatic fall in the AUD/USD pair, aligning with global economic turmoil.
Post-crisis, both recovered, but from 2010 to 2012, a decline in yields was mirrored by a downturn in the AUD/USD, showcasing the lag effect in currency response. The period of 2016-2018 is marked by an appreciation in the pair amidst falling yields, a divergence that is rectified when the pair eventually declines.
In 2020, a spike in yields led to a strong appreciation in the AUD/USD. The chart above demonstrates the interconnectedness of bond spreads and currency movements, albeit with varying degrees of immediacy and magnitude.
Using Spreads in Practice
Bond spreads can be a valuable tool in forex trading, but their application requires careful consideration. Here are key points to remember:
- Long-Term Trends: These relationships often unfold over several months or years—the charts included are monthly charts rather than weekly or daily charts.
- Bias Setting: Spreads can help establish a long-term bias in trading strategies, but they cannot be the sole reason for entering a position.
- Predictive Limitations: There are instances when spreads offer little to no predictive power, sometimes moving in tandem or diverging for extended periods due to other economic factors.
The Bottom Line
Understanding these spreads offers an invaluable perspective for forex traders. By integrating these insights into your strategy, you can make more informed decisions. To put this knowledge into practice, consider opening an FXOpen account and unlock a world of forex trading opportunities.
This article represents the opinion of the Companies operating under the FXOpen brand only. It is not to be construed as an offer, solicitation, or recommendation with respect to products and services provided by the Companies operating under the FXOpen brand, nor is it to be considered financial advice.
Stay ahead of the market!
Subscribe now to our mailing list and receive the latest market news and insights delivered directly to your inbox.


Latest articles

Ripple: Letter to Congress Stirs the Crypto Market
At the beginning of June, more than 200 crypto companies and industry groups — including Coinbase, Andreessen Horowitz and Ripple Labs — sent a letter to Senate Majority and Minority Leaders John Thune and Chuck Schumer, urging them to bring the Digital

GBP/JPY: Ascending Triangle Under Pressure
The GBP/JPY pair has come under pressure after the Bank of Japan raised its policy rate to 1.0% on 16 June. The Bank of England is following the opposite path: at its 30 April meeting, the Monetary Policy
Pound Under Pressure: Markets Await Bank of England And SNB Decisions
The British pound remains under pressure following weaker-than-expected inflation data, which has reinforced expectations of further monetary easing by the Bank of England. Investors are staying cautious ahead of today’s policy meetings of both the UK central bank and