


How Can You Spot Intermarket Correlations?
FXOpen
In the world of trading, understanding intermarket correlations can be an essential skill for making informed decisions. These correlations are broadly categorised depending on the asset type definition, offering unique trading opportunities. In this article, we will help you grasp the significance of that concept for more effective decision-making and risk management.
Types of Intermarket Correlations
There are three major types of market correlations.
Positive Correlations
Positive correlations occur when two or more asset classes move in the same direction. This means that as one asset's price rises, the other asset's price also tends to rise, and vice versa. For example, the oil market and stocks of oil exporting companies tend to rise together. Also, a weaker domestic currency can boost exports, resulting in the country's currency and the stocks of local export companies moving up together.
Negative Correlations
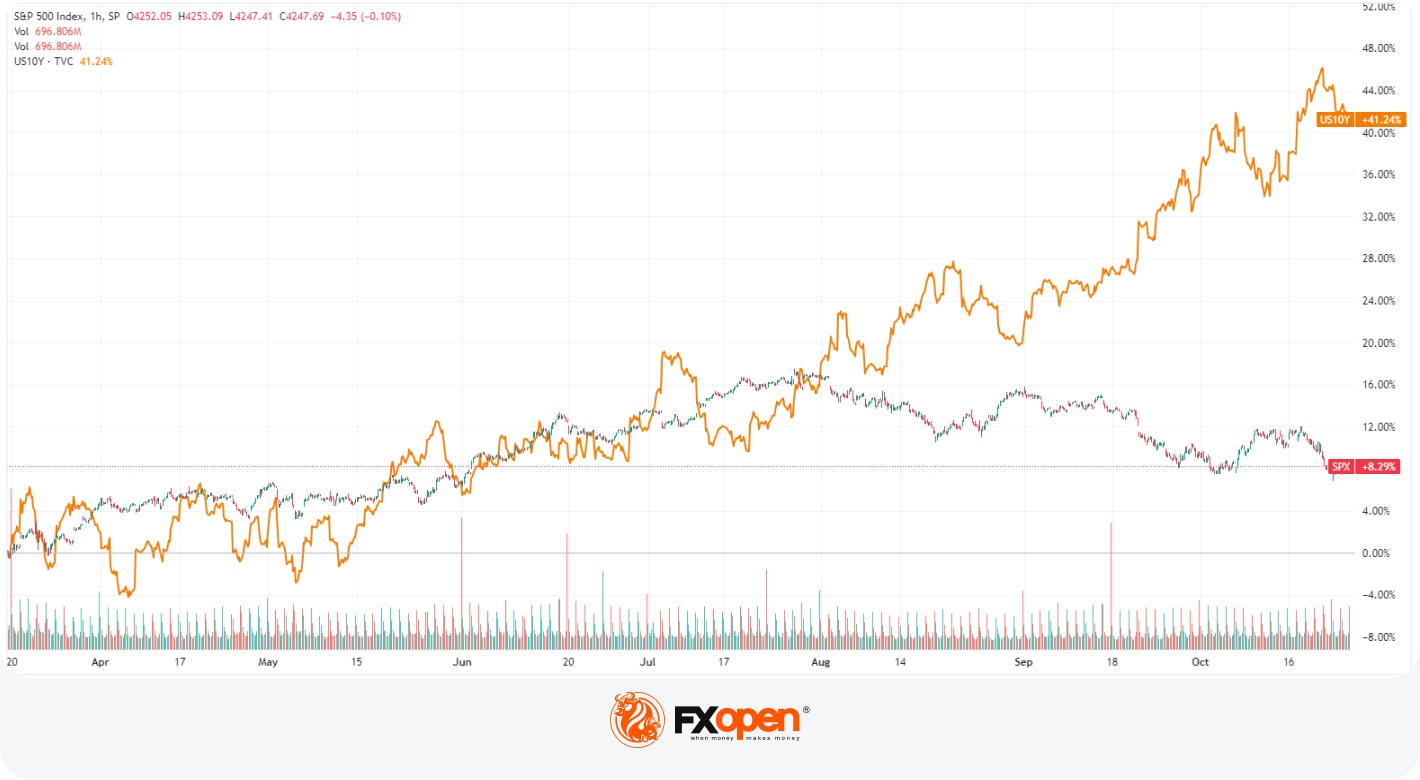
Negative, or inverse correlations, occur when two or more asset classes move in opposite directions. In this case, when one asset's price increases, the other asset's price tends to decrease, and vice versa. Stocks and treasury bonds have an inverse correlation. Crude oil prices are also often negatively correlated with the value of the US dollar, while gold has a negative correlation to equity markets.
No Correlation
No correlation indicates no discernible relationship between two or more asset classes. In other words, changes in the price or performance of one asset have no consistent effect on the other. Gold prices and real estate prices often exhibit no significant correlation, while the price of Bitcoin is typically not correlated with the prices of agricultural commodities like wheat or soybeans.
Key Intermarket Relationships in Different Asset Types
Let’s explore the intermarket relationships within various asset classes and shed light on some basic aspects.
Stock and Bond Asset Classes
Stocks and bonds often exhibit an inverse correlation, which is based on the concept of risk aversion. Stocks are perceived as riskier assets but they offer the potential for higher returns, while bonds are considered safer but provide lower returns. At times with high economic growth and low inflation, investors are more inclined to invest in stocks, anticipating higher corporate profits, causing bond prices to decline as their demand decreases. In contrast, during economic downturns or when inflation is a concern, investors often seek the safety of bonds, which can drive up their prices and result in a decline in stock prices.
Currency Markets and Commodities
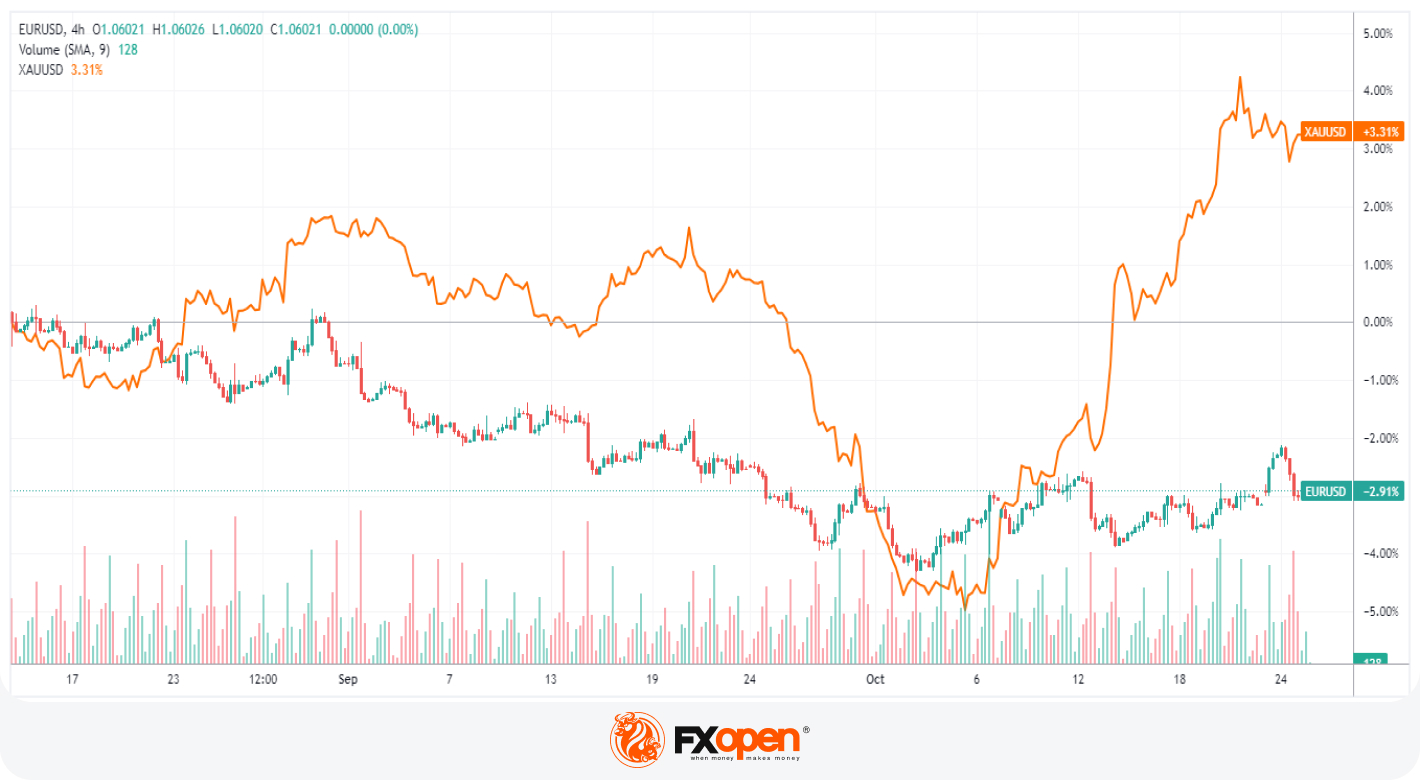
The interaction between currency markets and commodities is very complex, yet gold has a predominantly inverse correlation with major currency pairs because many of them serve as safe-haven currencies. For example, gold has a negative correlation with USD/CHF and USD/JPY pairs. At the same time, it has a positive correlation with commodity currencies, for example, the Australian dollar and Canadian dollar.
In the context of the global crude oil markets, geopolitical tensions in oil-producing nations that result in decreased supply can indeed cause oil prices to surge. However, the impact on the currencies of both importing and exporting countries is influenced by a multitude of factors, with demand being a crucial one. Increased demand can potentially lead to appreciation of the domestic currency of the oil exporting country, whereas lower demand may result in currency depreciation.
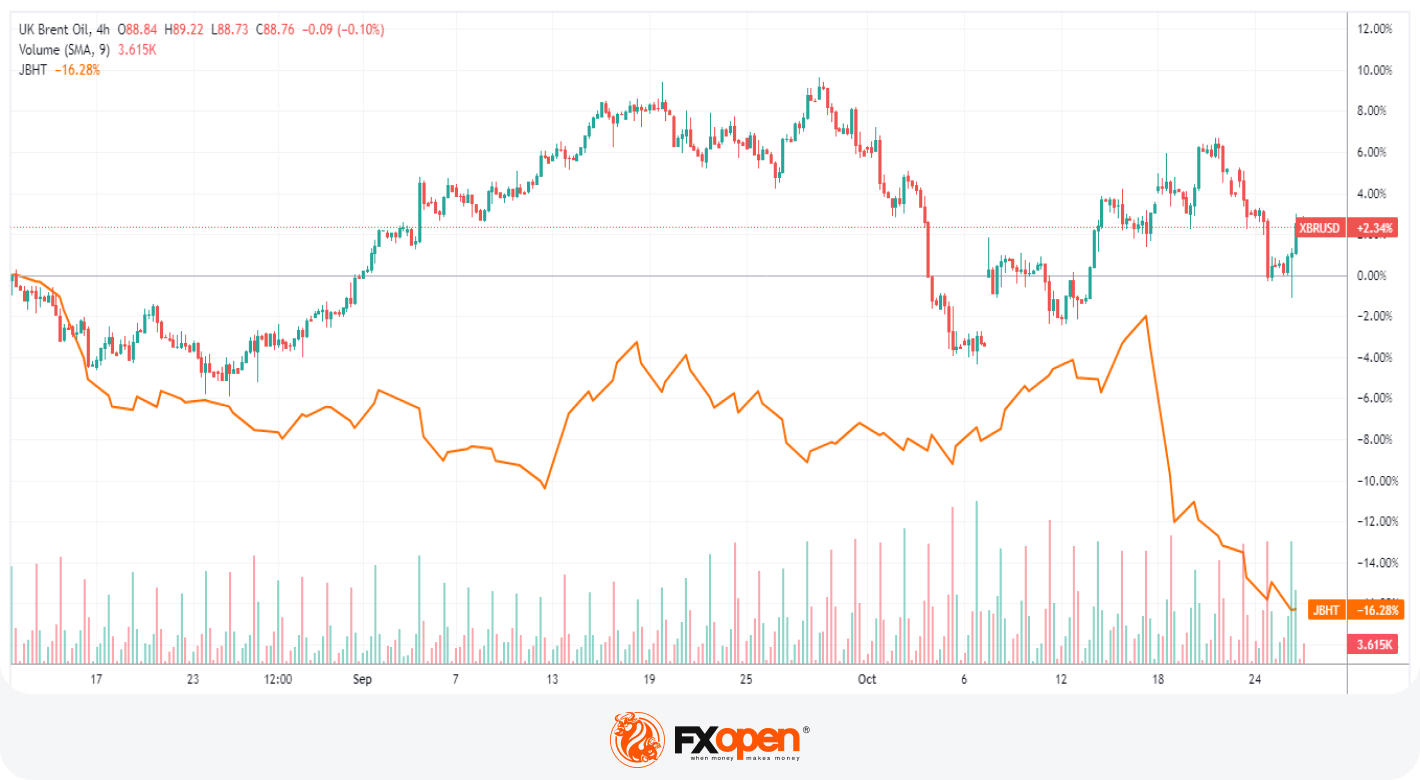
Oil Prices and Transportation Stocks
Oil prices have a direct and substantial impact on transportation companies, particularly those in the aviation, shipping, and trucking industries. Higher oil prices result in increased operating costs for these companies, including expenses related to fuel. As a result, rising oil prices can negatively affect the profitability of transportation companies, leading to declines in their stock prices.
Interested in new trading opportunities? You can visit FXOpen and try out all the available charting tools on the free TickTrader platform.
Trading Strategies Based on the Correlation Between Asset Classes
How can traders take on trading opportunities that leverage intermarket correlations? Correlation between assets provides opportunities for risk management, portfolio diversification, and the pursuit of profits.
Diversification and Portfolio Allocation
One of the primary applications of intermarket correlations is portfolio diversification. By identifying assets with low or negative correlations, traders can construct portfolios that are less susceptible to extreme volatility and risk. For instance, when stocks exhibit weakness, bonds often gain strength. The diversification strategy is built on the principle that uncorrelated or negatively correlated assets can mitigate overall portfolio risk, ultimately enhancing its resilience. Asset managers use the asset stock definition as a basis for making investment decisions and optimising a portfolio's asset allocation.
Hedge Strategies Based on Intermarket Relationships
Commodity prices are often influenced by currency movements. Traders can hedge commodity positions by taking offsetting positions in the currency markets. For example, if you hold a long position in oil futures, you can short the currency of a major oil-producing country. By hedging the currency exposure, you aim to neutralise this risk.
Trading Opportunities
Traders can use currency pair correlations to gauge market sentiment. During risk-on periods when traders are more willing to take risks, they may focus on buying higher-yielding currencies (e.g., AUD and NZD) and selling safe-haven currencies (e.g., USD and JPY). During risk-off periods, the opposite approach may be taken. Understanding these correlations can help traders align their strategies with the prevailing market.
You can try intermarket correlations trading by opening an FXOpen account!
Risks and Limitations
An important point to consider is that intermarket correlations are not static and can evolve over time due to various factors. Correlations can sometimes give false signals as there can be periods of divergence caused, for example, by extreme events, such as financial crises or unexpected geopolitical developments. Also, too many traders following the same asset correlations can lead to overcrowding in certain trades, resulting in rapid and unexpected market movements when sentiment suddenly shifts.
Conclusion
Correlations between assets offer potentially profitable trading opportunities, though recognising the limitations is also essential for success in the dynamic world of financial markets. By combining intermarket correlations with a comprehensive approach to market analysis, traders and investors can make more informed decisions, aligning their strategies with their financial objectives.
This article represents the opinion of the Companies operating under the FXOpen brand only. It is not to be construed as an offer, solicitation, or recommendation with respect to products and services provided by the Companies operating under the FXOpen brand, nor is it to be considered financial advice.
Stay ahead of the market!
Subscribe now to our mailing list and receive the latest market news and insights delivered directly to your inbox.


Latest articles

Pound Weakens After Soft UK Inflation Data as Euro Awaits Fresh Market Signals
The pound remains under pressure following the release of weaker-than-expected UK inflation data. The slowdown in inflation has strengthened expectations that the Bank of England could adopt a more accommodative policy stance in the coming months, weighing on sterling. Meanwhile,

Alphabet: Record Profit as Markets Await Their Verdict
On 22 July, Alphabet reported its Q2 2026 results, with revenue rising 24% year-on-year to $119.8 billion. Google Cloud revenue surged 82% to $24.77 billion, comfortably exceeding analysts' expectations. Search advertising generated $63.3 billion in revenue (+17%

NZD/USD Analysis: A Tug-of-War at the Critical Level
The kiwi has strengthened meaningfully against most peers this month. However, against the US dollar specifically, NZD/USD remains well below its 2026 highs, trading in the mid-0.58 area versus January's peak near 0.6075.
New Zealand's Q2 inflation