


How to Measure Volumes with the Volume Profile Visible Range Indicator
FXOpen
In the intricate landscape of financial markets, grasping the significance of trading volume across various assets is paramount. This aspect of the market represents the ability to dissect and comprehend its dynamics— a skill often developed by experienced traders. Working with established platforms like FXOpen, market participants have access to a myriad of analysis techniques. Among these, Volume Profile Visible Range analysis stands out as a method offering noteworthy insights into market behaviour.
This detailed approach investigates the relationship between price movements and trading volumes, granting traders a profound understanding of market sentiment and probable price marks.
The Pillar of Technical Analysis: What Is Volume Analysis?
Volume study serves as a foundational pillar of technical analysis, catering to traders' pursuit of insights into market trends and potential reversals. It revolves around quantifying the number of assets or contracts traded within a specified period, thereby gauging the force behind price movements.
What Is a Volume Profile Visible Range Indicator?
A Volume Profile Visible Range indicator, often abbreviated to VPVR, delves deeper into the realm of volume analysis. Unlike a standard volume metric that provides a singular total trading volume figure, the VPVR displays the distribution of trading volumes at varying price points within the visible range of bars or candles on a chart. This distinction allows traders to comprehend volume dynamics for the specific portion of the chart they are viewing.
In contrast, the Volume Profile Fixed Range (VPFR) provides a similar view but gives users the flexibility to define the start and end points of the volume analysis. This makes it easier to investigate volume for a selected range.
Regardless of the version used, the result is a visual representation that pinpoints where the majority of trading activity has occurred, shedding light on crucial price levels and overall market sentiment.
Components of the Volume Profile Visible Range
The VPVR Indicator is characterised by several integral components:
Price Ranges: The indicator segments the price axis into distinct ranges.
Volume Bars: Within each price range, horizontal bars represent the cumulative volume traded at the corresponding price level.
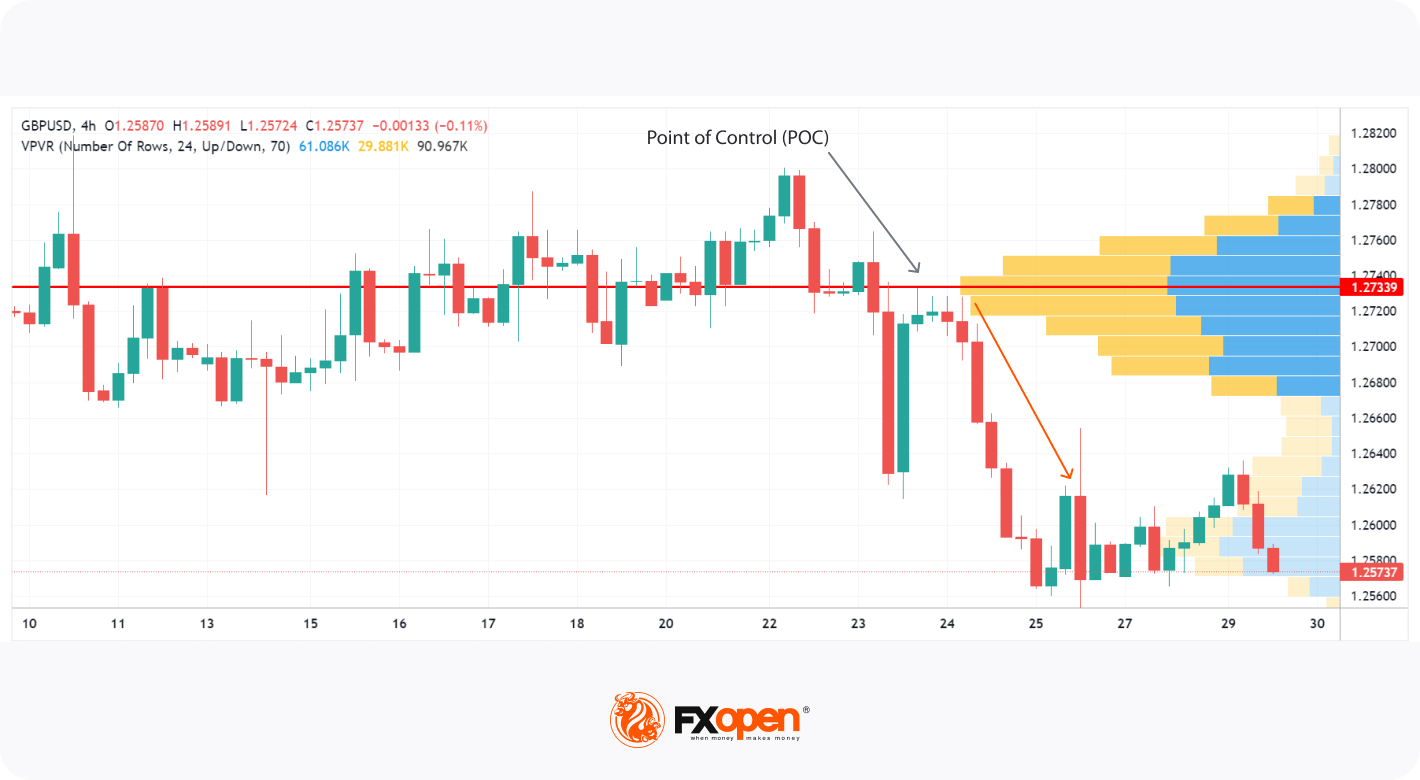
Point of Control (POC): This denotes the price level at which the highest trading volume has been observed. The POC carries potential significance, often representing a focal point for market participants.
Value Area: Comprising a specified percentage of total trading volume, typically around 70-80%, the value area signifies the range of prices where the majority of trading activity occurred. It can signal zones of potential support and resistance.
Understanding the Calculation: How the Volume Profile Formula Works
The process of determining the Volume Profile Visible Range is more intricate than merely tallying up the traded volumes. Here's a basic outline of how it's computed:
Data Collection: The first step is gathering the raw trading data. This includes details of every trade that took place within the desired time frame, noting both the traded price and the volume of each trade.
Price Segmentation: The price range over the specified period is divided into segments. Each segment represents a specific price range.
Volume Attribution: For each of these price segments, the total volume of trades that occurred within that price range is calculated. This provides a volume figure for each price segment.
Visual Representation: These volume figures are then depicted as horizontal bars, with the length of each bar proportional to the volume traded within that price segment. This visualisation method allows traders to easily see at which price levels the most trading activity occurred.
Platforms like TickTrader simplify this process. They automatically collect and process the raw data and then visually present it in the form of an indicator. While the underlying computations might be complex, the end result is an intuitive graphic that traders can use to inform their strategies.
How to Use Volume Profile Visible Range Indicator
When delving into how to use the volume profile in your trading strategies, you'll find that the VPVR indicator is a versatile tool that equips market participants with a range of signals and insights to aid their decision-making processes. By carefully analysing these signals, traders can fine-tune their strategies and navigate the intricate landscape of the market more effectively.
Let's delve deeper into how the Volume Profile Visible Range can be utilised to interpret and respond to various market scenarios, along with explanations of how to read these signals on the charts.
Visual Insights: Market Volume Charts & Identification of Support and Resistance
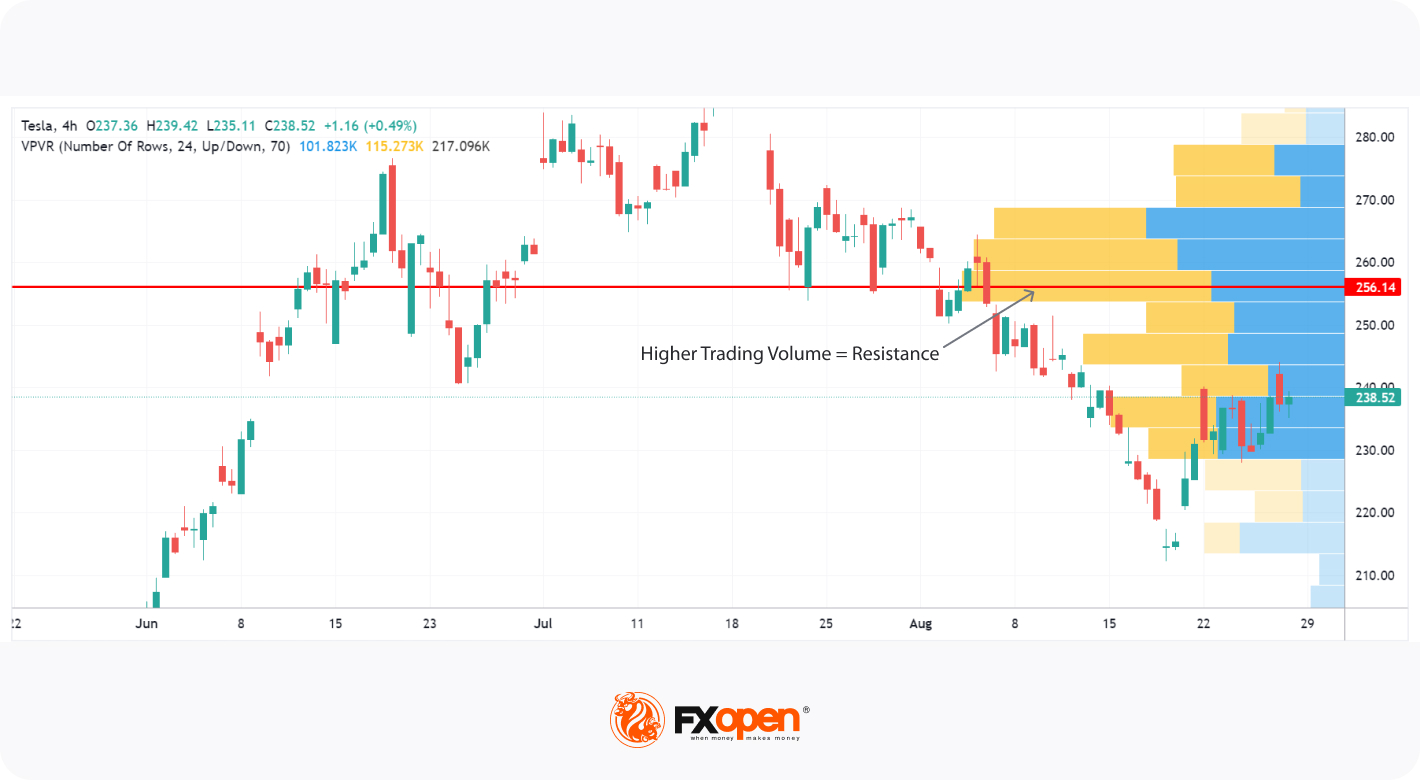
One of the core strengths of the VPVR Indicator is its capability to identify areas of significant volume accumulation, which in turn indicates potential levels of support and resistance.
How to Read It on Charts: On the chart, observe where the vertical bars of the Volume Profile are tallest. These areas signify higher trading volumes and correspond to potential support and resistance levels. The height of the bars indicates the intensity of trading activity at those levels.
In the stock market volume chart, the indicator vividly highlights these areas, providing traders with insights into zones where the market outlook has coalesced around specific price points.
Detection of Price Rejection
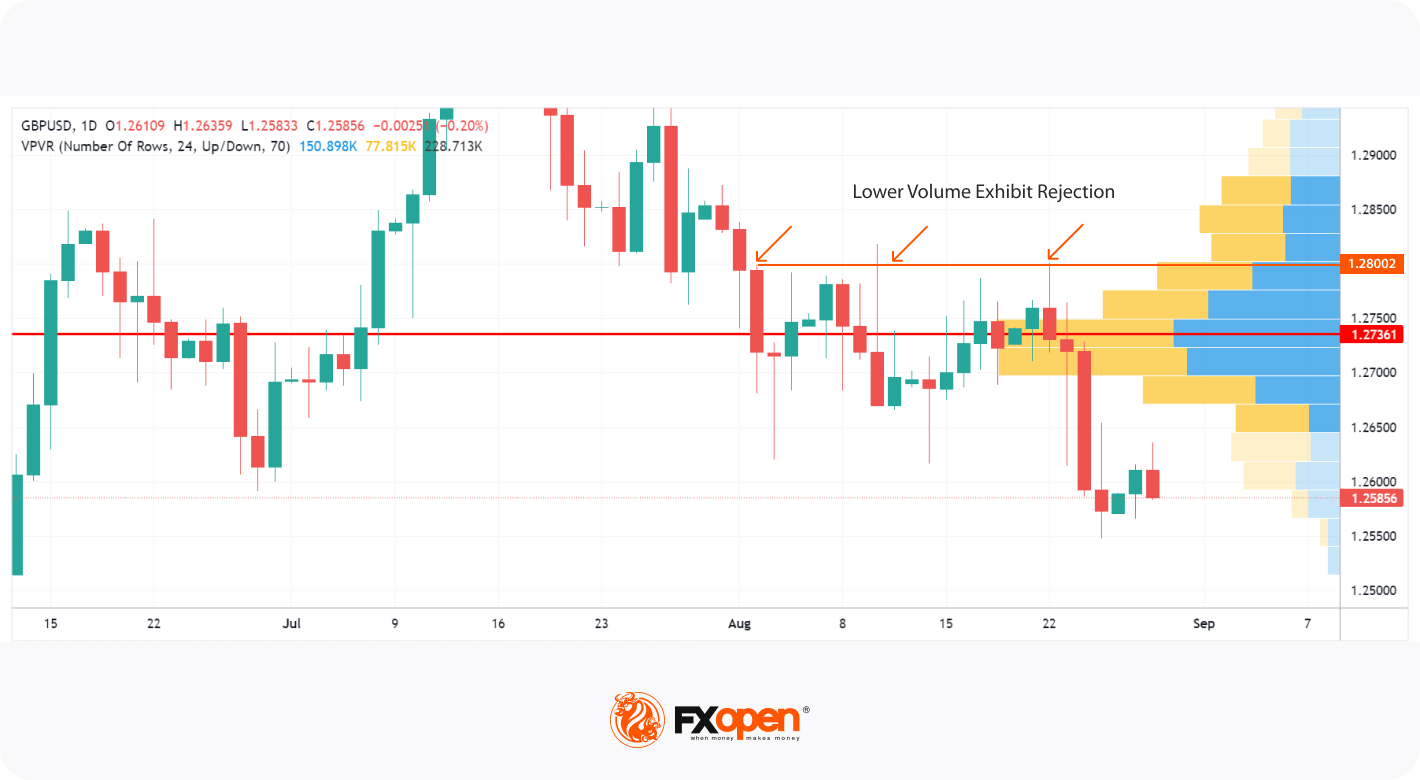
Low-volume zones are instrumental in the volume profile analysis, serving as indications of instances where the market has hesitated or swiftly rejected certain price levels.
The chart below showcases these zones, which suggest that market participants have been cautious or unwilling to engage in trading at these levels. These zones can act as early signals of potential trend reversals, urging traders to exercise caution and seek further confirmation before making trading decisions.
How to Read It on Charts: Identify areas on the chart where there are horizontal gaps in the indicator’s bars. These gaps correspond to low-volume zones, signalling potential price levels where the trading space has shown reluctance to move.
Confirmation of Breakouts
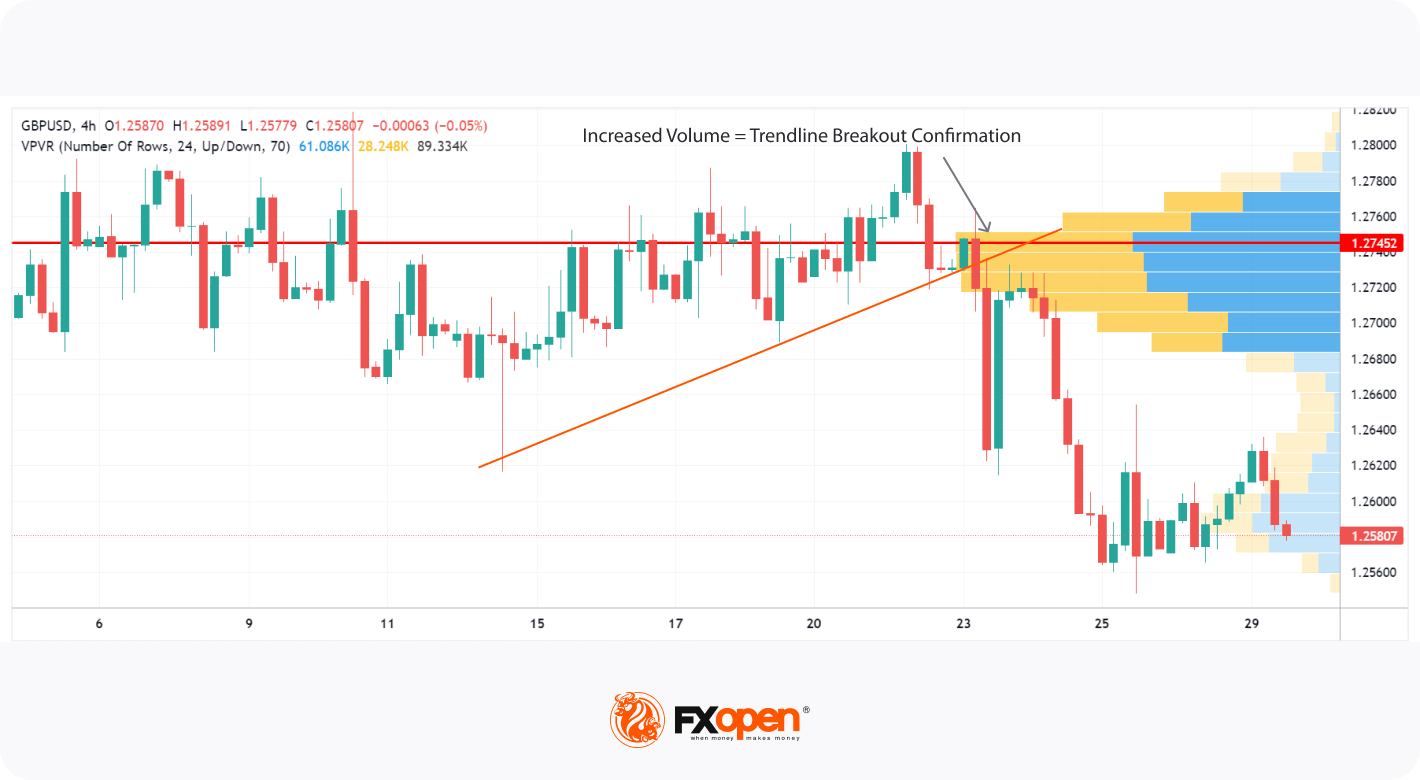
Breakouts, marked by sharp price movements beyond established levels, are pivotal events for traders. The Volume Profile Visible Range plays a key role in confirming the legitimacy of breakouts. In the chart below, the surge in volume accompanying the breakout provides credibility to the emerging trend. This heightened volume activity validates the breakout's potential strength and sustainability, boosting traders' confidence in their trading decisions.
How to Read It on Charts: During a breakout, check if the breakout candle coincides with a significant increase in trading volume, as indicated by taller bars.
Validation of Trends
Trends are fundamental to market analysis, and the Volume Profile's Point of Control (POC) aids in trend validation. The chart below demonstrates how a shifting POC reflects changing market sentiment.
When candles close above POC, it implies an emerging uptrend, showcasing growing market enthusiasm for higher prices. Conversely, a downward shift could indicate a developing bearish trend, signalling increasing interest in lower prices.
Monitoring POC shifts provides traders with insights into evolving trends and enables them to align their strategies accordingly.
How to Read It on Charts: Observe the location of the POC regarding the price. A higher POC suggests bearish sentiment, while a lower POC implies bullish sentiment.
Limitations
Despite its utility, the Volume Profile Visible Range indicator does have limitations:
- It can generate incorrect signals, especially during increased volatility.
- It may not account for sudden news events that can disrupt regular market patterns.
For enhanced accuracy, traders consider cross-referencing signals with other technical tools.
Conclusion
The Volume Profile Visible Range is an indispensable tool for traders seeking to unravel the intricate tapestry of market dynamics. To harness the full potential of these analytical tools, you can consider opening an FXOpen account. By delving into the symbiotic relationship between price movements and trading volumes, traders can pinpoint crucial support and resistance levels, confirm breakout movements, and authenticate prevailing movements.
However, it's vital to recognise that, like any tool, the Volume Profile Visible Range isn't infallible and should be utilised alongside other analyses to mitigate potential false signals.
This article represents the opinion of the Companies operating under the FXOpen brand only. It is not to be construed as an offer, solicitation, or recommendation with respect to products and services provided by the Companies operating under the FXOpen brand, nor is it to be considered financial advice.
Stay ahead of the market!
Subscribe now to our mailing list and receive the latest market news and insights delivered directly to your inbox.


Latest articles

AUD/CAD: Months of Indecision — Is a Breakout Finally Coming?
The Australian dollar has clawed back most of its end-of-June losses, when it touched three-month lows against the greenback amid escalating Middle East tensions. Since then, sentiment has improved: the RBA's Assistant Governor Sarah Hunter signalled the board stands ready

USD/JPY: Battling at the Top of the Triangle
On 3 July, Japan's Finance Minister, Satsuki Katayama, stated that the Ministry of Finance remains in close contact with US authorities regarding developments in USD/JPY as the yen traded near its weakest level in almost 40 years. Similar verbal

Dow Jones (DJIA): Consolidation Beyond the Trend
Federal Reserve Chair Kevin Warsh testified before Congress on 14–15 July, reaffirming the Fed's commitment to bringing inflation back to target while providing no clear guidance on the future path of interest rates. Meanwhile, June inflation data came in