


How to Trade a Bump and Run Pattern
FXOpen

Chart patterns are an essential method of market analysis. One such powerful yet often overlooked chart pattern is the bump and run pattern. It, characterised by a rapid price movement followed by a significant correction, offers traders a reliable framework for identifying potential reversals and capitalising on market movements. In this FXOpen article, we will cover how to spot this formation on a price chart and learn how to apply it in trading.
What Is the Bump and Run Pattern?
The bump and run, also known as the bump and run reversal pattern, identifies potential price reversals in financial markets. It was developed by Thomas Bulkowski in 1996 who worked on price prediction techniques using trendlines. The bump and run setup occurs when an asset experiences a sustained period of price appreciation followed by increased momentum which leads to a reversal. It also has an inverted form, meaning that the price moves in a downtrend before a reversal occurs. Traders like using these setups because they can be easily identified on price charts when trading forex, stocks, commodities, and cryptocurrencies*.
How to Identify the Bump and Run Pattern
Now that we know what the bump and run is, let's discuss how we can identify it on charts. We will explain the rules for bullish and bearish formations. The first step is to spot a trend that is forming with a clear support and resistance range. The sudden momentum increase (bearish setup) or decrease (bullish setup) after a continuous move is the first indication that the bump and run may be forming. It can be easier to identify the setup by learning its three phases.
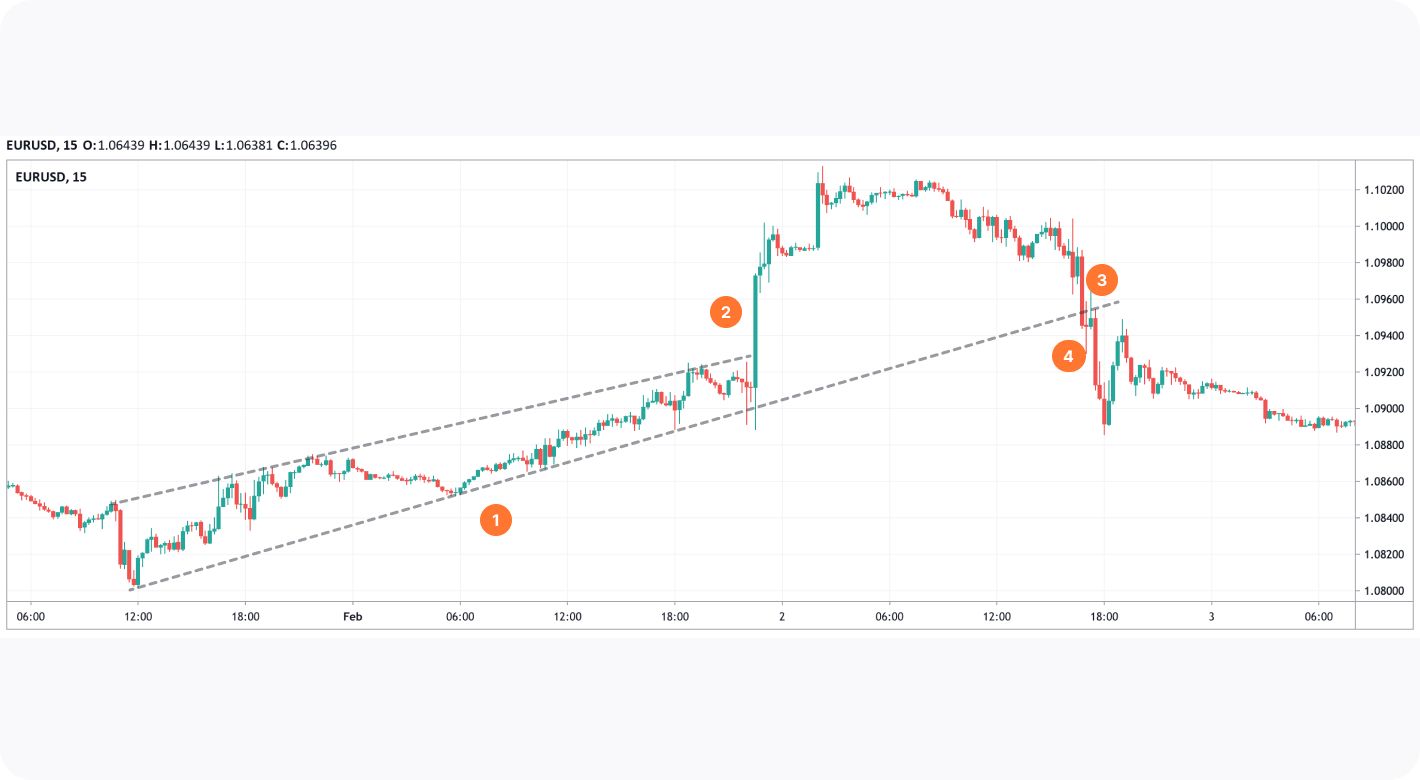
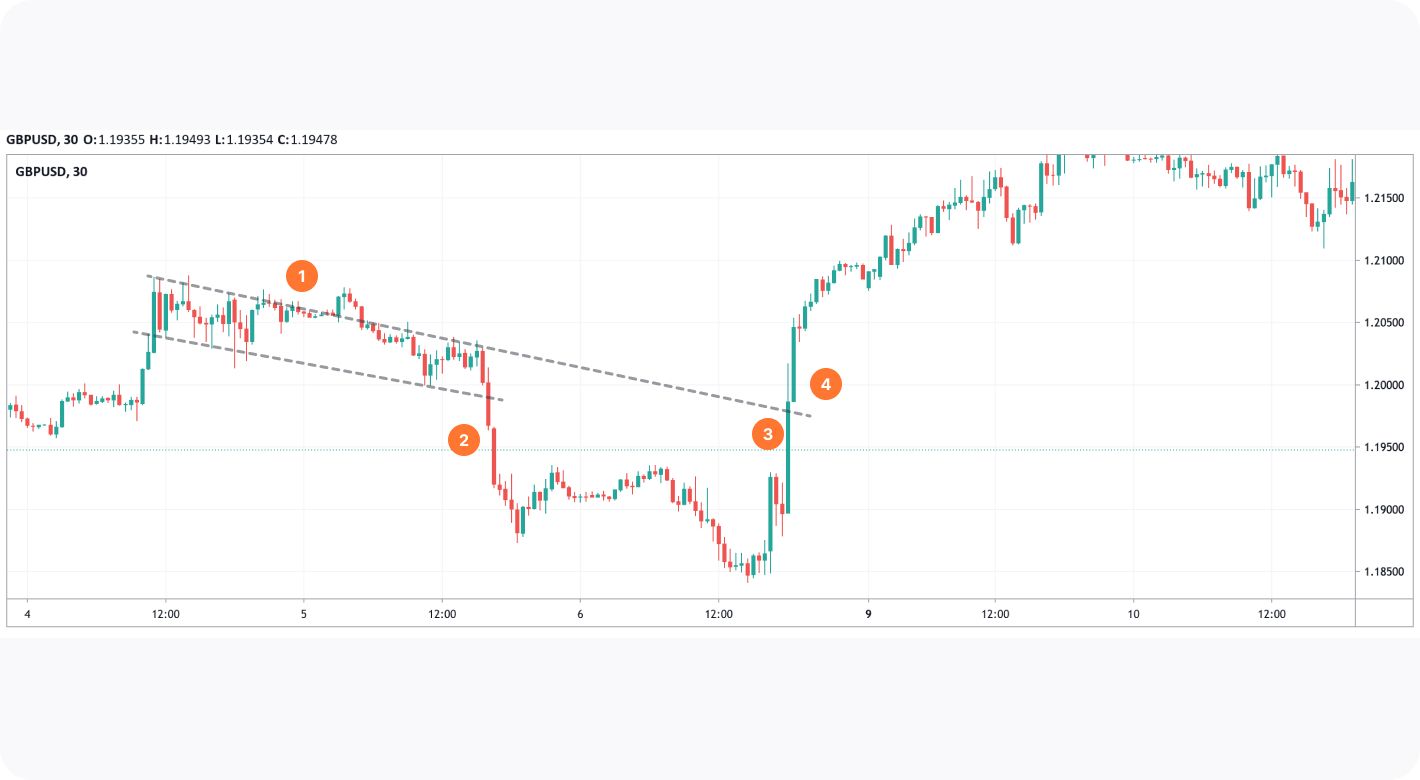
1. Lead-in trendline
This is the stage of initiating a trend that's forming ascending support in the case of an uptrend and a descending resistance in the case of a bearish trend. It is what leads to the bump and run formation, and it usually means that the price is starting to pick up momentum. In later phases, the lead-in trendline serves as an indication of a reversal.
2. The bump
After the initial support or resistance trendline is formed, we see an accelerating momentum in asset growth or depreciation. This sudden rise or fall is called the bump. It’s the final higher high or a lower low, depending on whether it's a bullish or a bearish trend. In some cases, the move can be parabolic; but generally, it is a spike that picks up liquidity from buyers or sellers and enters the resistance or support zone.
3. The run
The asset starts to struggle to keep its momentum going and soon makes a reversal to its lead-in trendline. Finally, a breakout occurs. It’s the final phase called the run. Following a breakout, a trader can open a sell position after a bullish trend or a buy position after a bearish trend. Still, they should be ready for the asset to retest the breakout trendline so that it will turn into resistance after the price breaks it down and into support after it breaks it up.
How to Construct a Bump and Run Pattern
The formation can be constructed using price history and volume data:
- Outline a trend: The first step in constructing it is to identify the trend – downtrend for a bullish pattern and an uptrend for a bearish pattern.
- Look for a bump: The next step is to look for a period when the asset experiences a sudden and sustained increase (bearish pattern) or decline (bullish pattern), known as a bump.
- Verify a reversal: After the bump, the price will experience a sudden reversal. At first it will fall back down to its lead-in trendline, retesting it for support once again (bearish pattern), or rise back to lead-in trendline, retesting it for resistance (bullish pattern).
- Look for a breakout: The final step in constructing this formation is to look for a breakout – a downfall below the ascending trendline and a rise above the descending trendline.
Bump and Run
Inverted Bump and Run
How to Trade Bump and Run Patterns
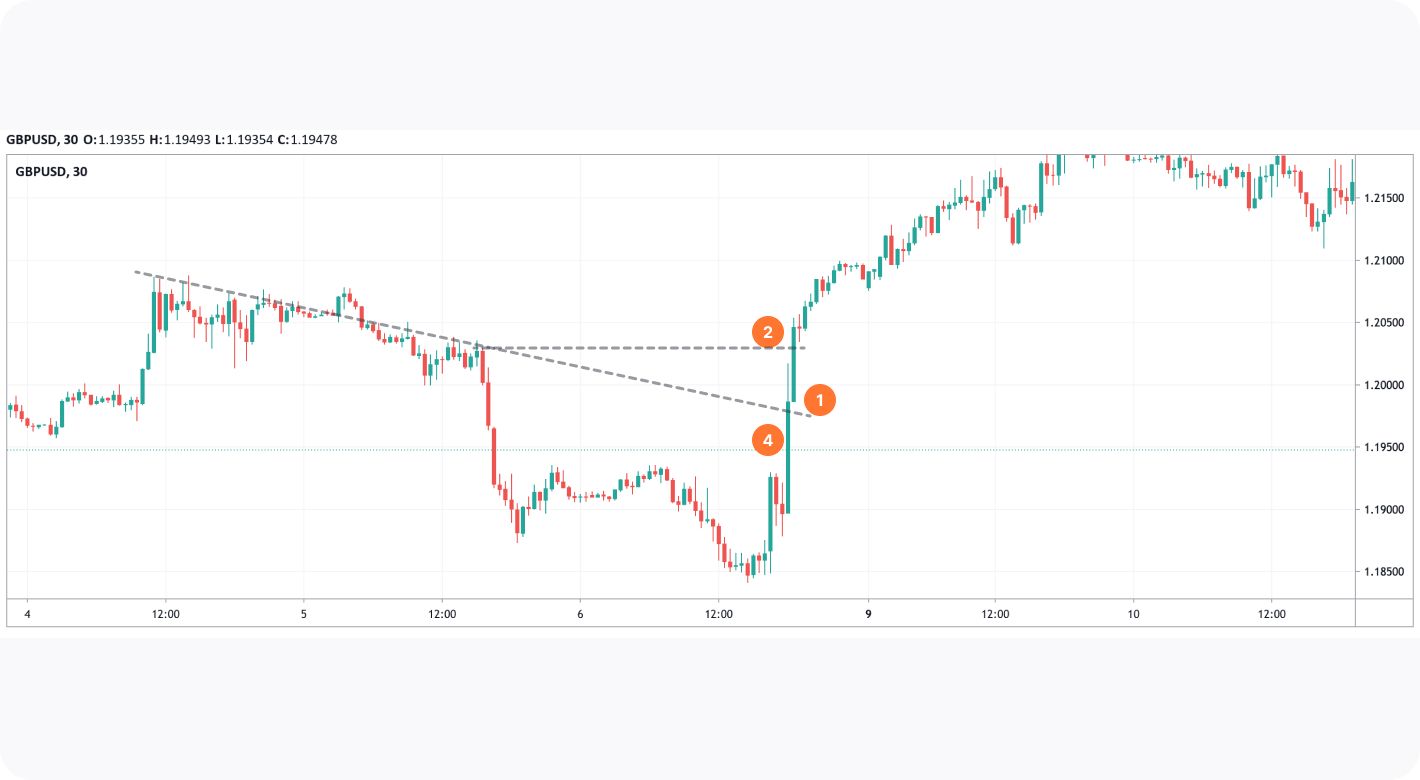
The bump and run trading pattern is simple. Traders can first identify it on the price chart using the TickTrader platform. Once it has been identified, the next step is to wait for it to break the lead-in trendline.
When a breakout occurs, traders can enter the market in the breakout direction. If it's made out to the downside, traders can open the short position and if the pattern is inverted and the run part of it develops to the upside, a long position can be opened.
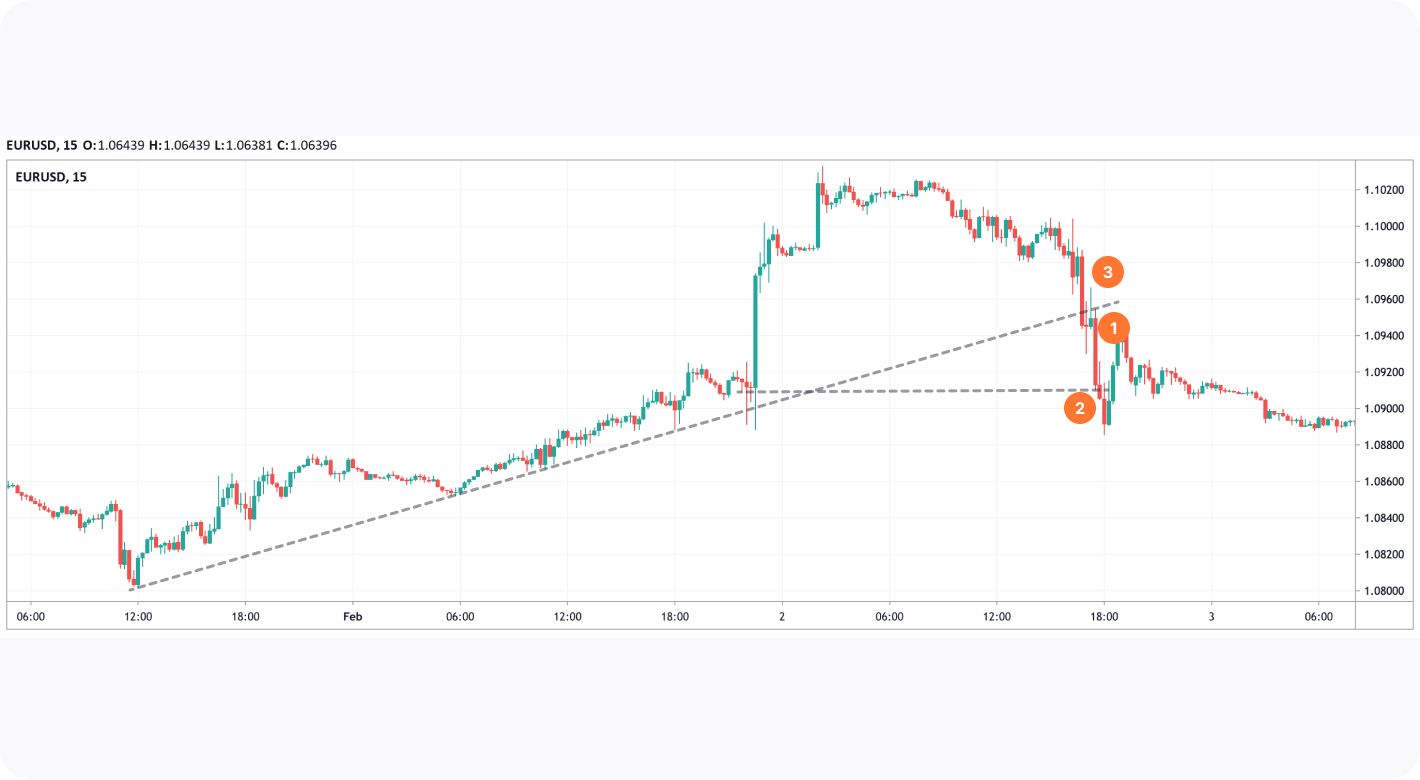
The theory says that the safest place to enter this position is at the breakout from the trendline (1), as that would reliably signal a reversal.
A take-profit target can be placed to at least the levels from which the bump phase started (2) and usually the price continues moving further. A stop-loss level can be placed above the ascending trendline in a bearish pattern (3) and below the descending trendline in a bullish pattern (4).
Traders must also be aware of the potential risks when trading. For example, the price may not break out in the direction that was expected, or it may not move as far as was expected. To minimise these risks, traders set a favourable risk to reward ratio according to the projected levels.
Takeaway
In conclusion, the bump and run pattern can be a valuable tool for traders looking to find a setup for potential buying or selling opportunities in the financial markets. By following this guide and taking the necessary steps to minimise risk, traders can improve their chances of success when trading it.
If you want to start trading the bump and run pattern, you can open an account at FXOpen, identify the pattern and apply the rules we discussed in this guide. Make sure to enter the position upon a breakout confirmation and set up your position levels according to your risk level and reward ratio.
*At FXOpen UK and FXOpen AU, Cryptocurrency CFDs are only available for trading by those clients categorised as Professional clients under FCA Rules and Professional clients under ASIC Rules, respectively. They are not available for trading by Retail clients.
This article represents the opinion of the Companies operating under the FXOpen brand only. It is not to be construed as an offer, solicitation, or recommendation with respect to products and services provided by the Companies operating under the FXOpen brand, nor is it to be considered financial advice.
Stay ahead of the market!
Subscribe now to our mailing list and receive the latest market news and insights delivered directly to your inbox.


Latest articles

US Dollar Index Analysis: Dollar at a Crucial Point, What's Next?
As the chart shows, the US Dollar Index (DXY) has gained more than 4% from its January lows, with the move accelerating from February 2026 onwards. Today, the dollar finds itself at a technically and fundamentally critical point, one that

US Natural Gas: Inventory Surplus Continues to Weigh on Prices
The US natural gas market (XNG/USD) is entering the summer season under the influence of two opposing forces. Domestically, the picture remains bearish. According to the EIA, working gas in underground storage stood at 2,688 billion cubic feet

Forex Kill Zone Times and ICT Trading Sessions
Kill Zone trading is a